


We have developed a new agriculture farm management software platform for our client AgroGPS. And as always we decided to share our experience in developing this brilliant project. We experienced a lot of moods and obstacles during the development, but the result is one that makes us proud.
Customer need
It all started with the requirement of our current customer AgroGPS to improve an agriculture farm management software platform that they had in their portfolio. An update of the existing platform was needed, developed in CakePHP on the back-end and the front-end custom developed in jQuery, JS, HTML, and CSS.
In addition to updating the libraries and technologies used, new functionalities needed to be developed. The most important aspect is that the web application is also accessible from phones and tablets because farmers spend a lot of time in the field and a solution is needed to quickly access information about the farm, the position of the tractors, and the activity they are doing over time real.
The agriculture farm management software platform must be connected to a GPS antenna that transmits the data in real-time so that the farmer is constantly informed about the activity of the farm and allows him to make quick decisions according to the problems that arise in the field.
Along with AgroGPS, we have also developed a Mobile GPS manual guidance application for agricultural vehicles and GPS precision agriculture. You can find in their portfolio the manual guidance application, automatic guidance, the monitoring application that we discuss in this article, but also a mobile application for measuring agricultural land with the help of a precision GPS antenna.
The proposed solution for agriculture farm management software
Analyzing the client his requirements and needs, we started an analysis of the project. We identified the critical elements that we have to implement, aspects related to the optimization of processes and reports, as well as the creation of a design that allows quick access to information on all types of devices.
We have divided the project into several stages so that we can develop it in an organized way that allows us constant feedback and feedback from the client because time must be spent carefully. Each stage is outlined around an essential function. The following milestones thus appeared: project setting, vehicles, vehicle reports, areas, and area reports.
The deadline was a tight one because the farmers’ activity was starting again shortly, but the project was completed in the time agreed with the client.
Development of agriculture farm management software
We developed the agricultural farm monitoring software platform, with a team consisting of two senior software engineers with a solid background in the development of digitization platforms and automation of internal processes within a company. The team was mixed, so each member handled a frontend and a backend component.
The technologies used for the development of the software platform
The development stack of the platform was chosen after analysis, and the result led to the choice of a client-server architecture, implemented in NodeJS for the backend and VueJS 3 for the front end.
The development of the server application was done using NodeJS, with the ExpressJS framework. The connection to the relational database, MySQL, is made using the Sequelize ORM.
For the development of the client application, we opted for VueJS 3, being the last stable version, with the Vuetify framework that allowed us to reuse some predefined components. The map displayed in the application, as well as the operations of adding, modifying, or deleting areas, is made through Leaflet integration. The connection of the vehicles and the real-time display on the map is done with the help of a socket connection, using socket.io.
The modules of agriculture farm management software
The development of the platform was achieved by dividing it into milestones that represent the basic modules of the web application. Next, we will discuss the core features we have implemented for the agriculture farm management software platform.
Authorization
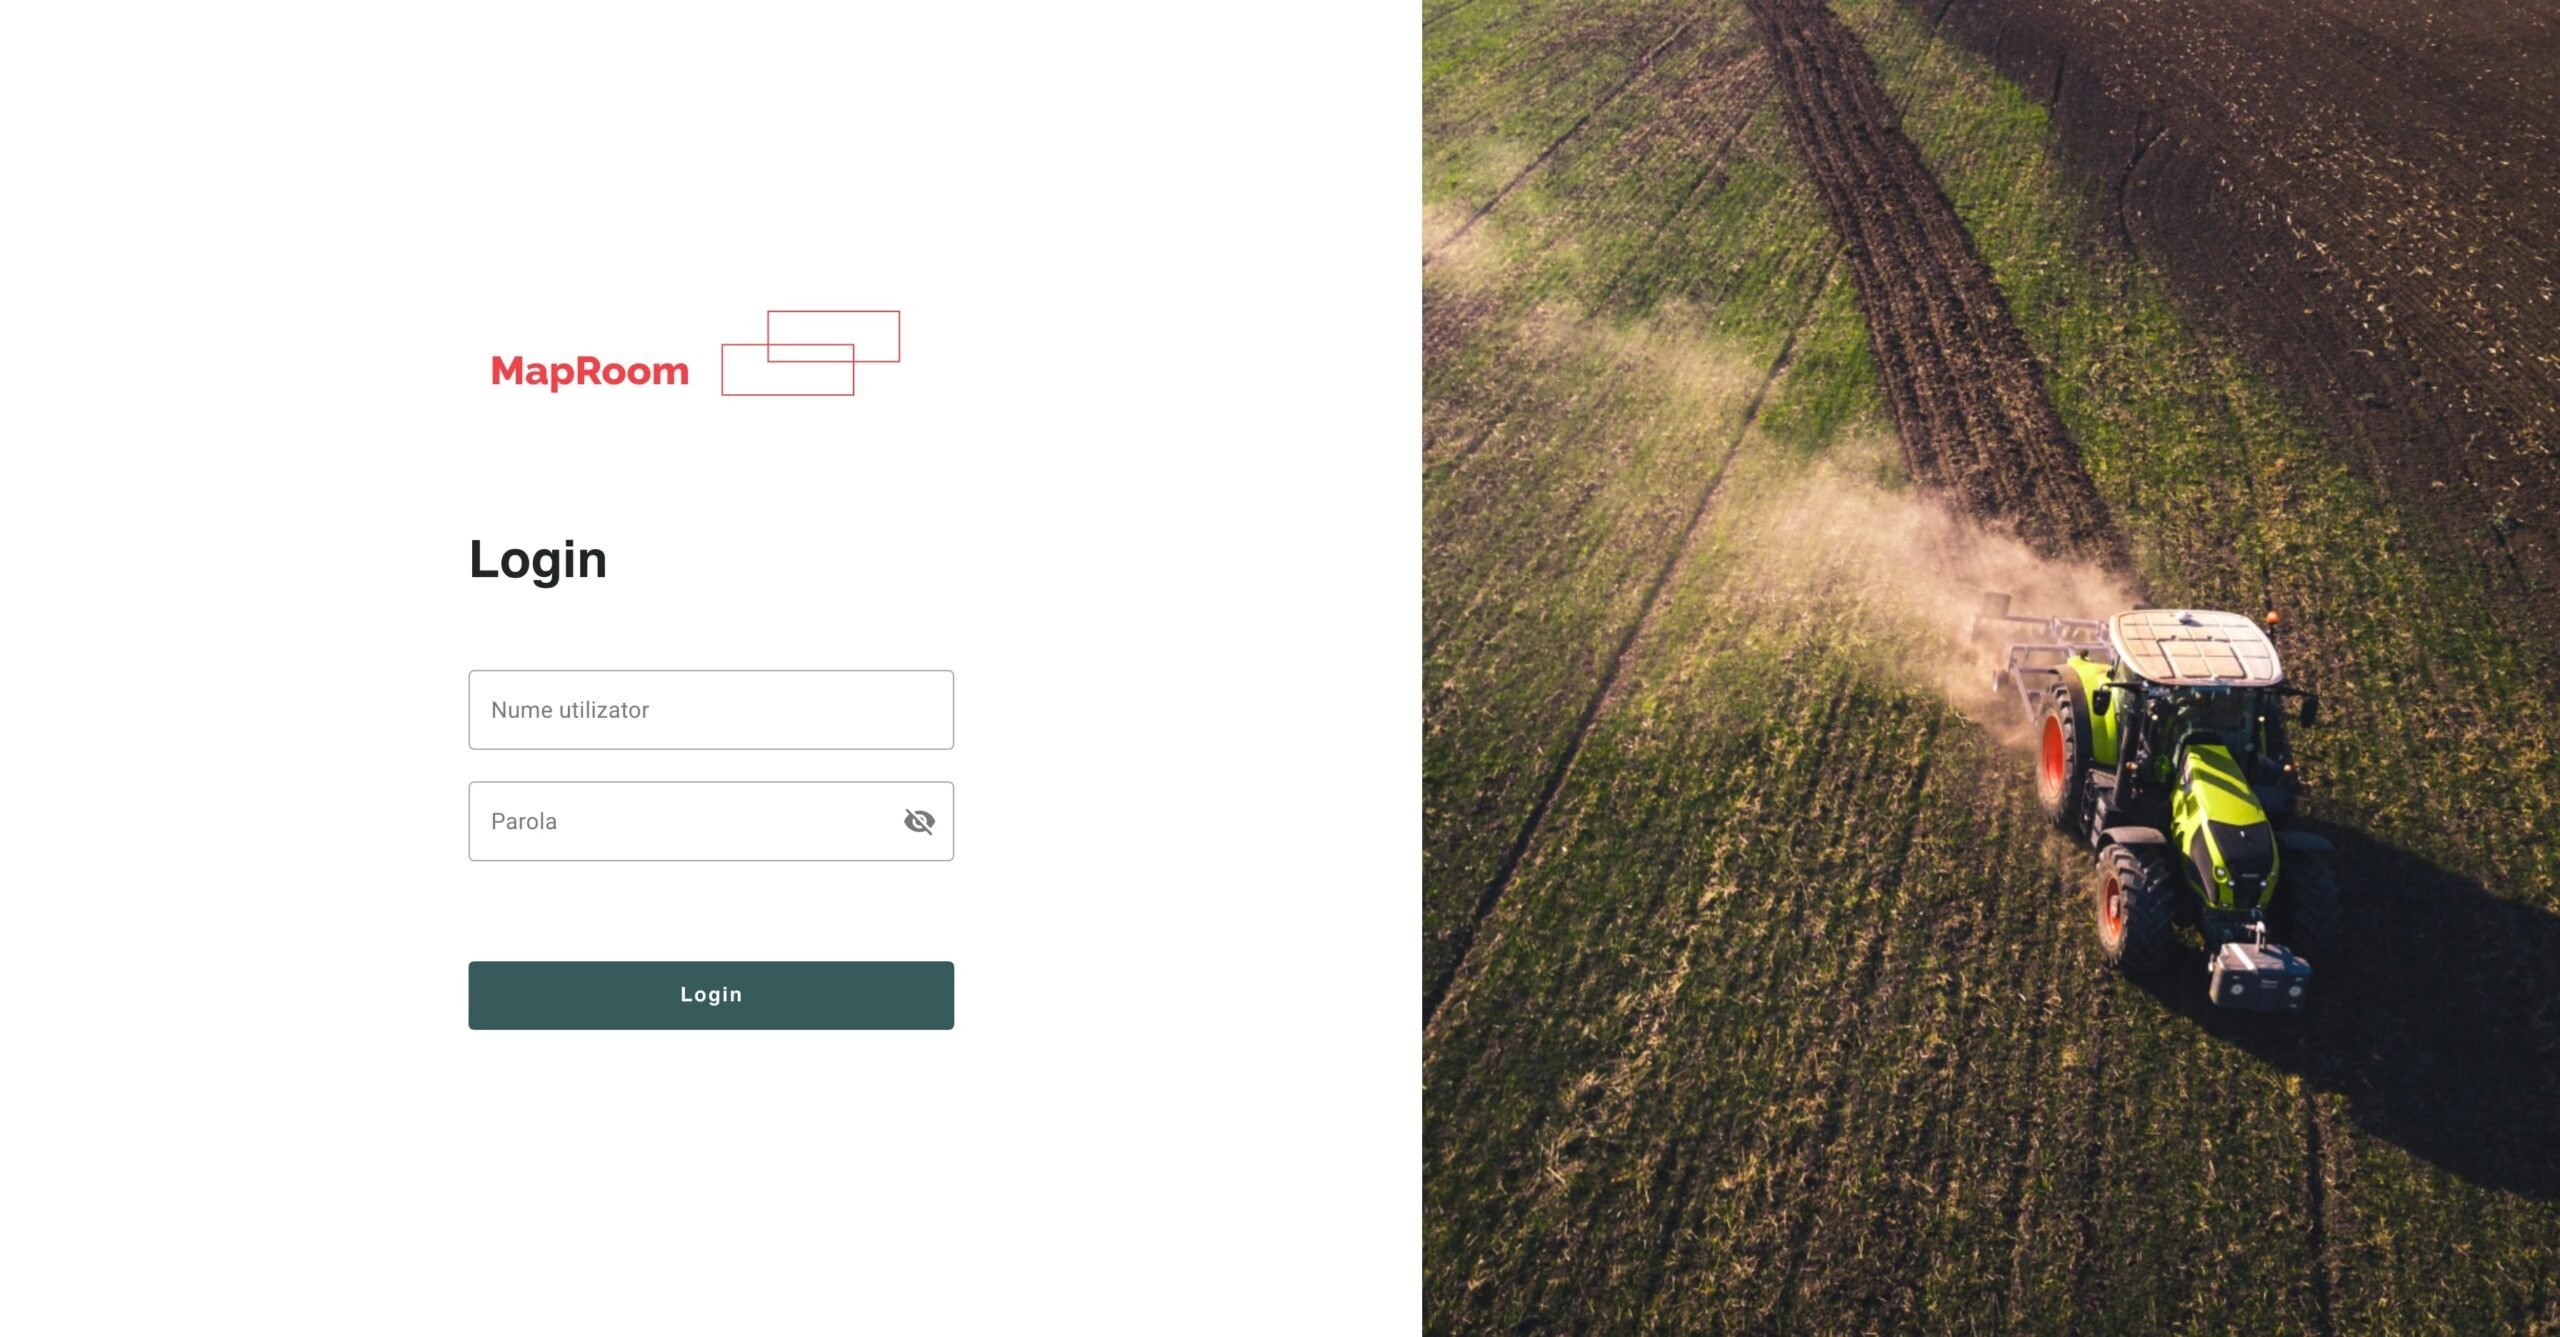
The user’s access to the agriculture farm management software platform is achieved by accessing the login screen, where he enters the user name and password, then presses the Login button. Afterward, the user is redirected to the main page if the access data was correct or an error will be displayed.
Update account data
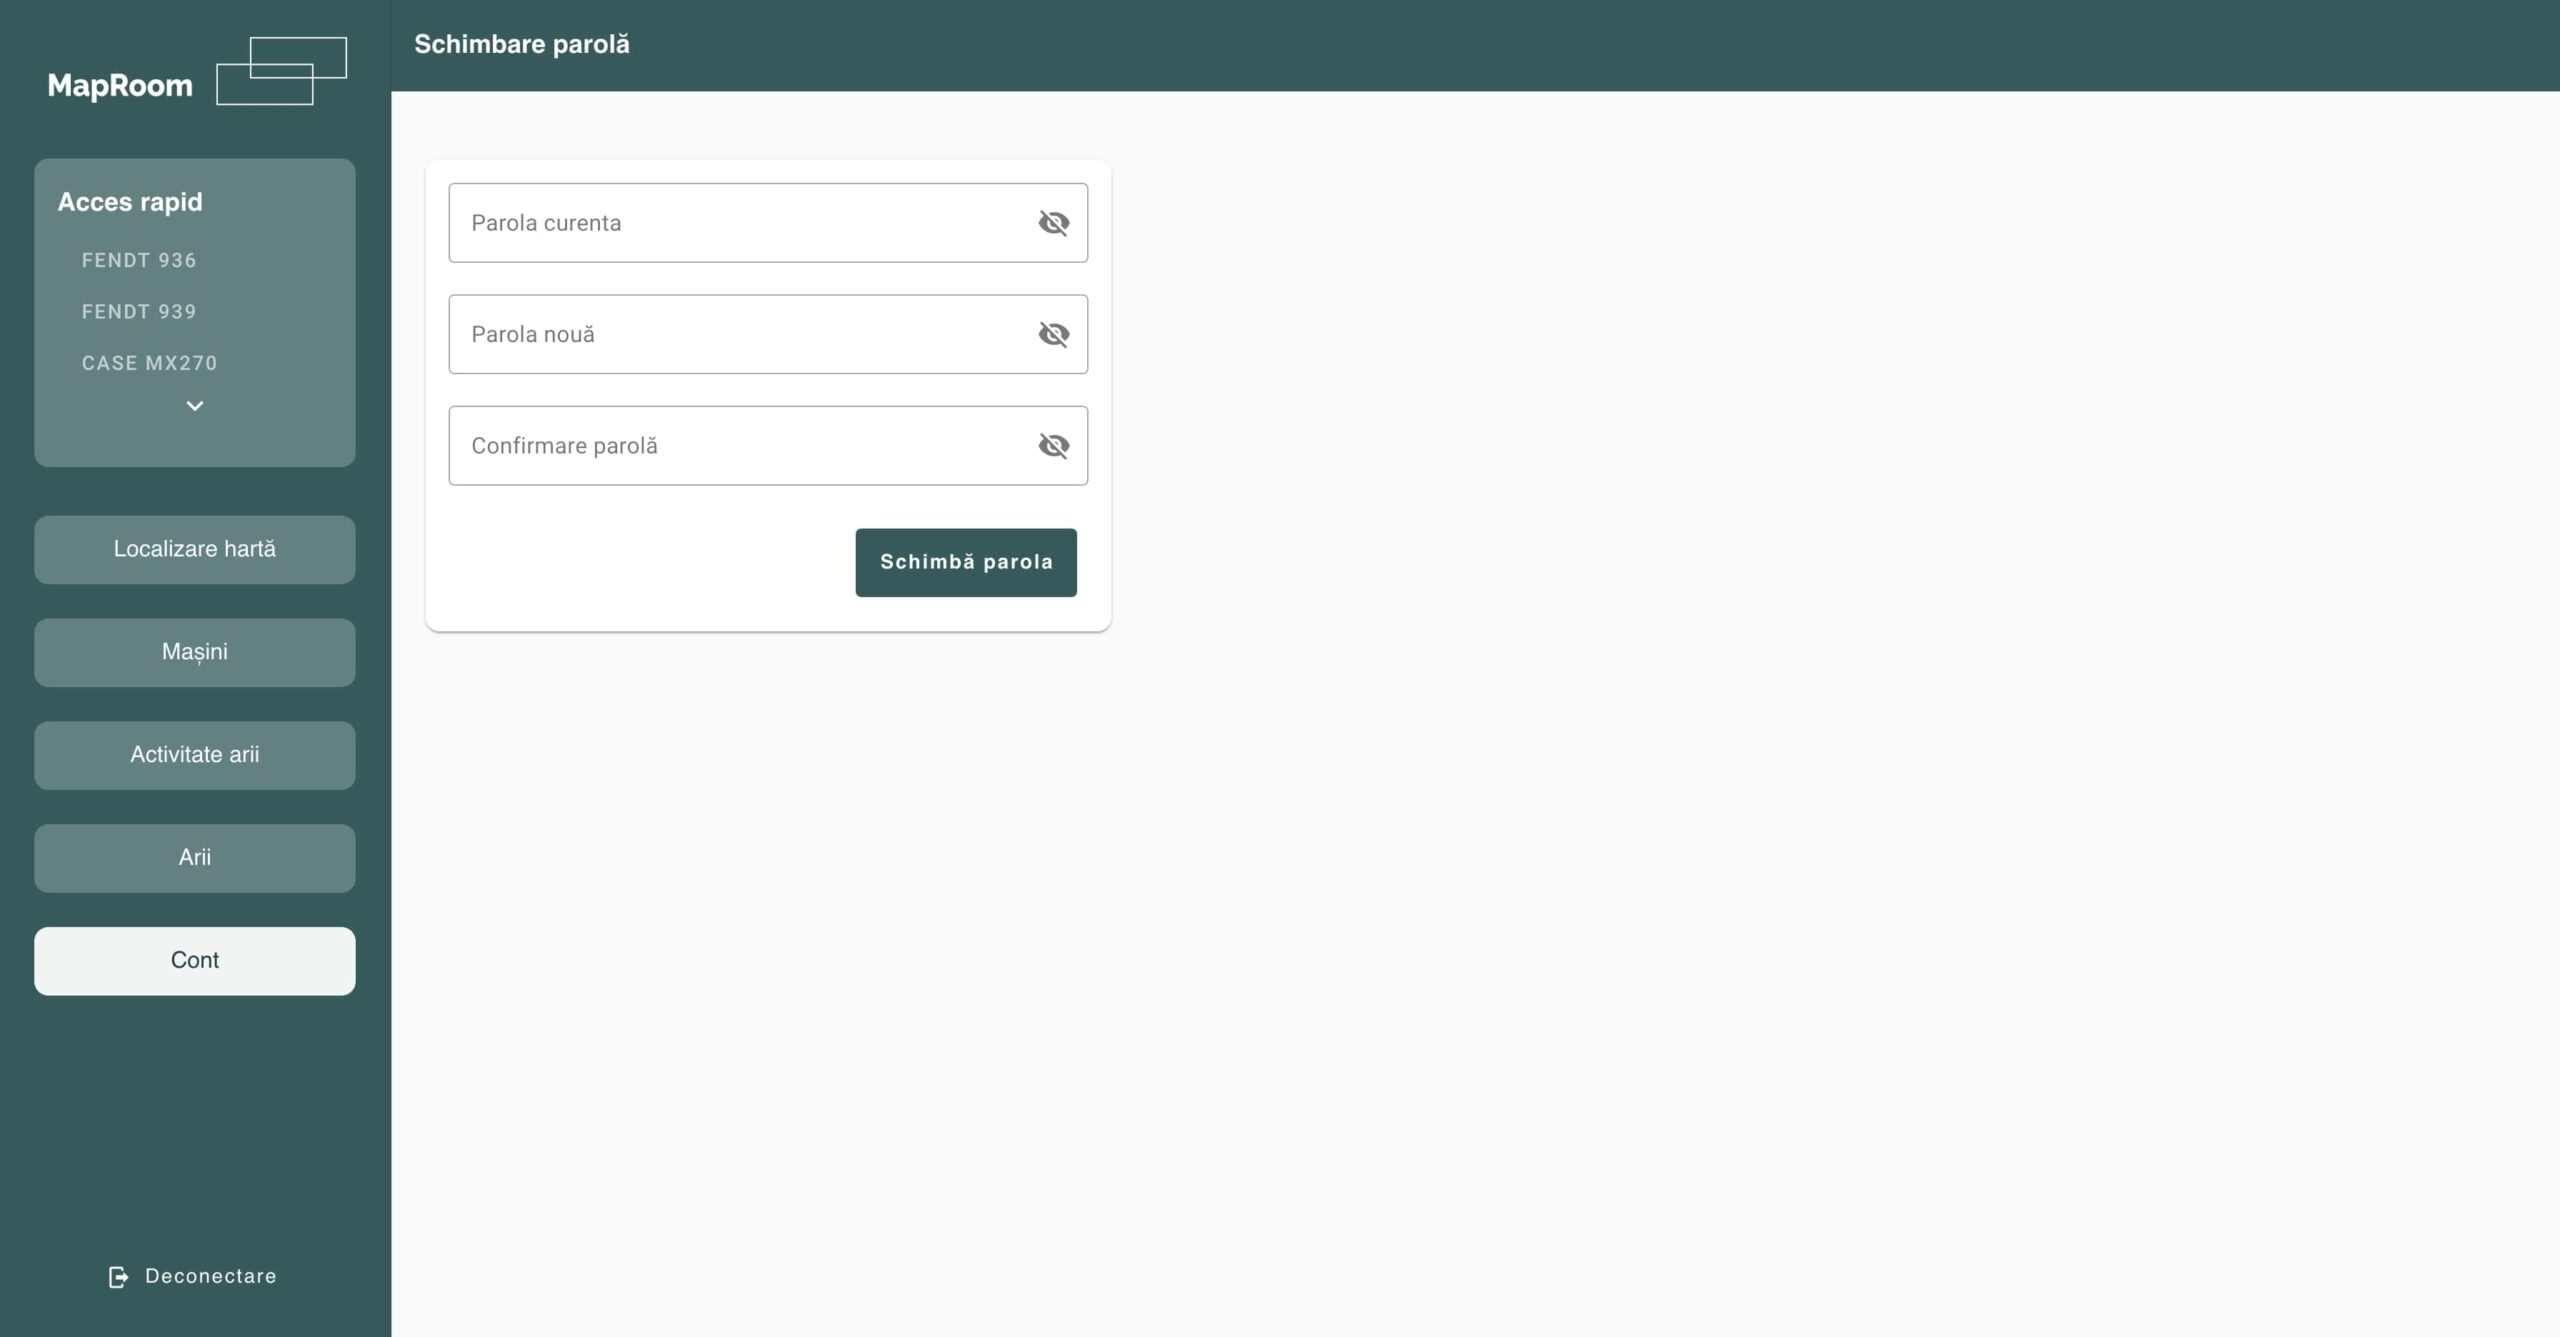
To update the account password go to the Account screen, from the main menu bar.
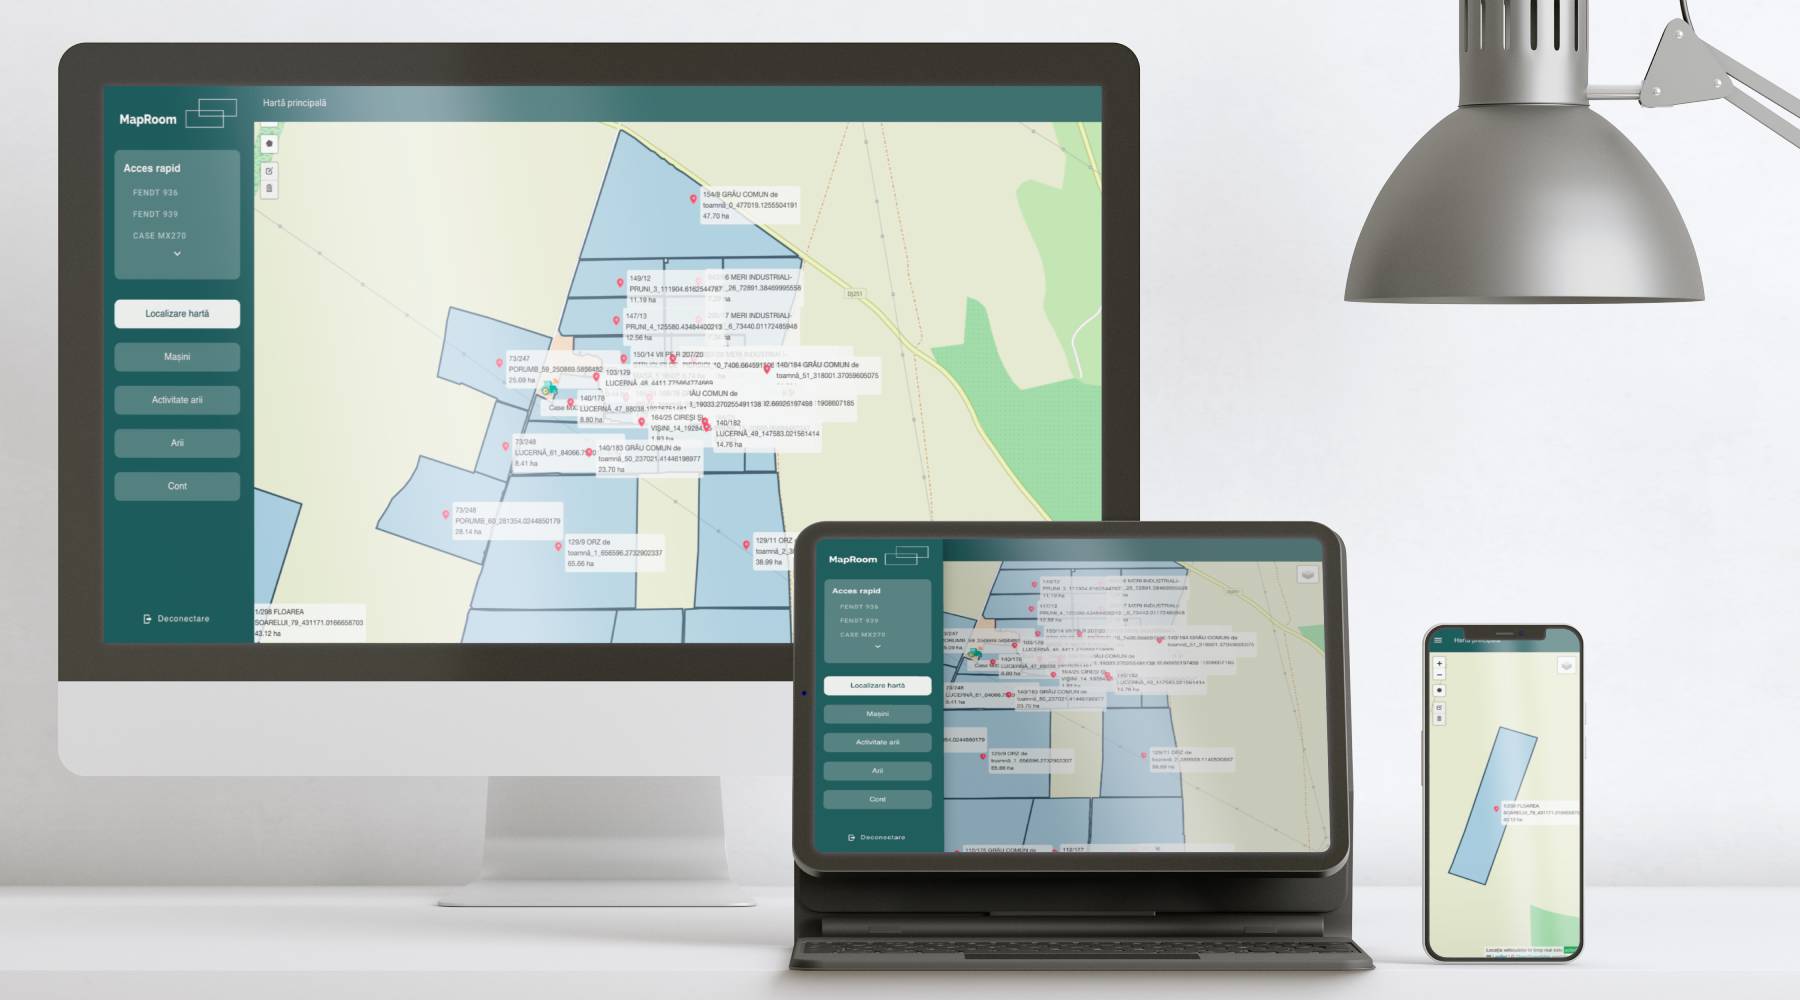
The main screen of the web application
The main screen of the agriculture farm management software platform is divided into 3 main areas, which can be found throughout the application.
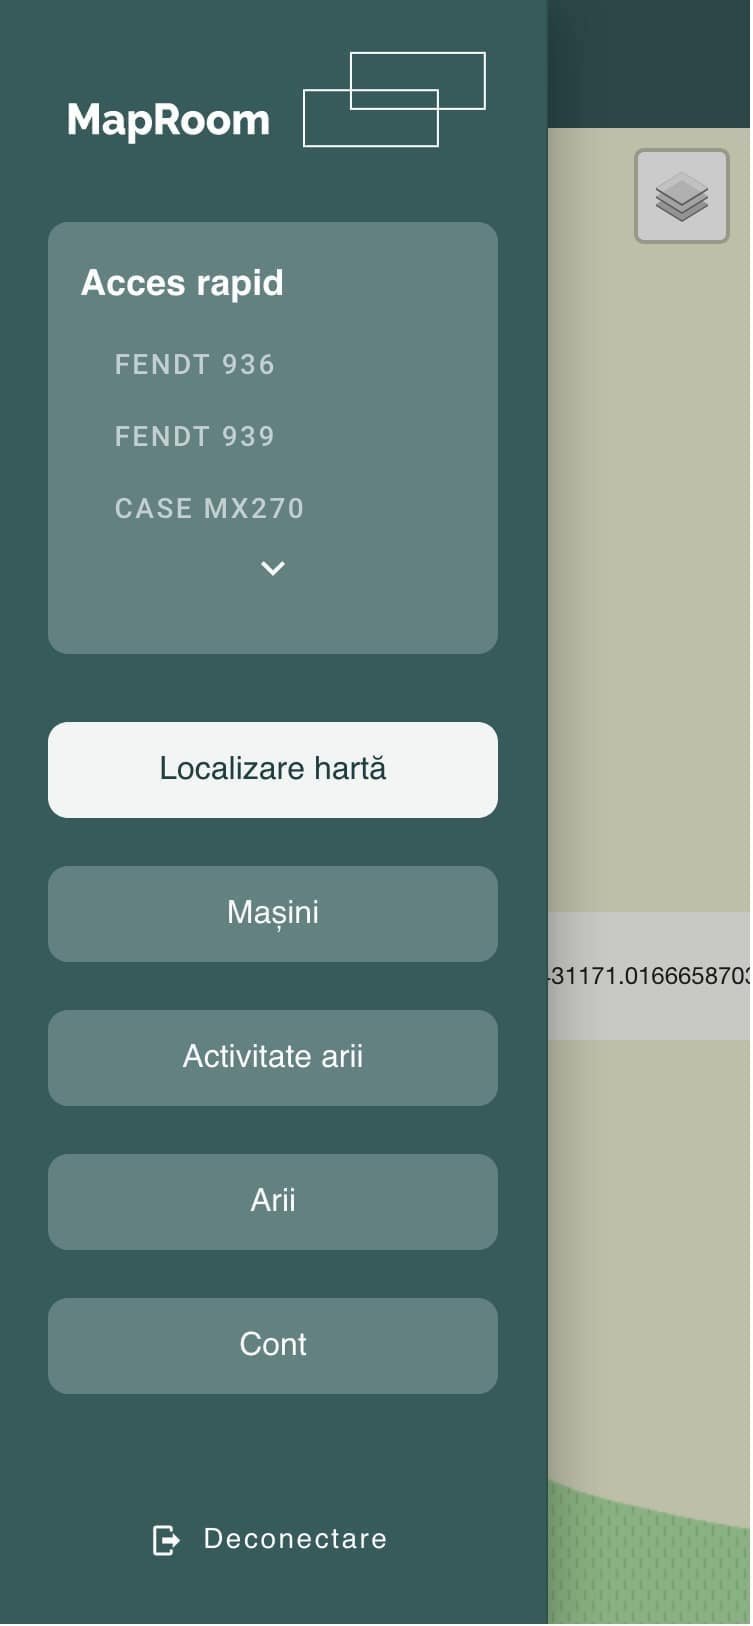
The main menu is framed on the left side of the entire height of the screen, both on desktops and on tablets or mobile. In the case of the latter, the menu bar is hidden by default and can be accessed by clicking on the hamburger menu. On this bar there is a quick access block, where the entire fleet of farm vehicles is listed, by clicking on the name of the vehicle, the user is redirected to the report page of the respective vehicle. In the second part of the navigation bar is the menu and at the bottom is the logout button.
A secondary menu bar is displayed at the top of the screen, on which the page title and other relevant elements for the respective screens such as buttons or the period selector will be displayed. On mobile screens, the hamburger menu button that shows/hides the menu bar will be displayed on the left side of this bar.
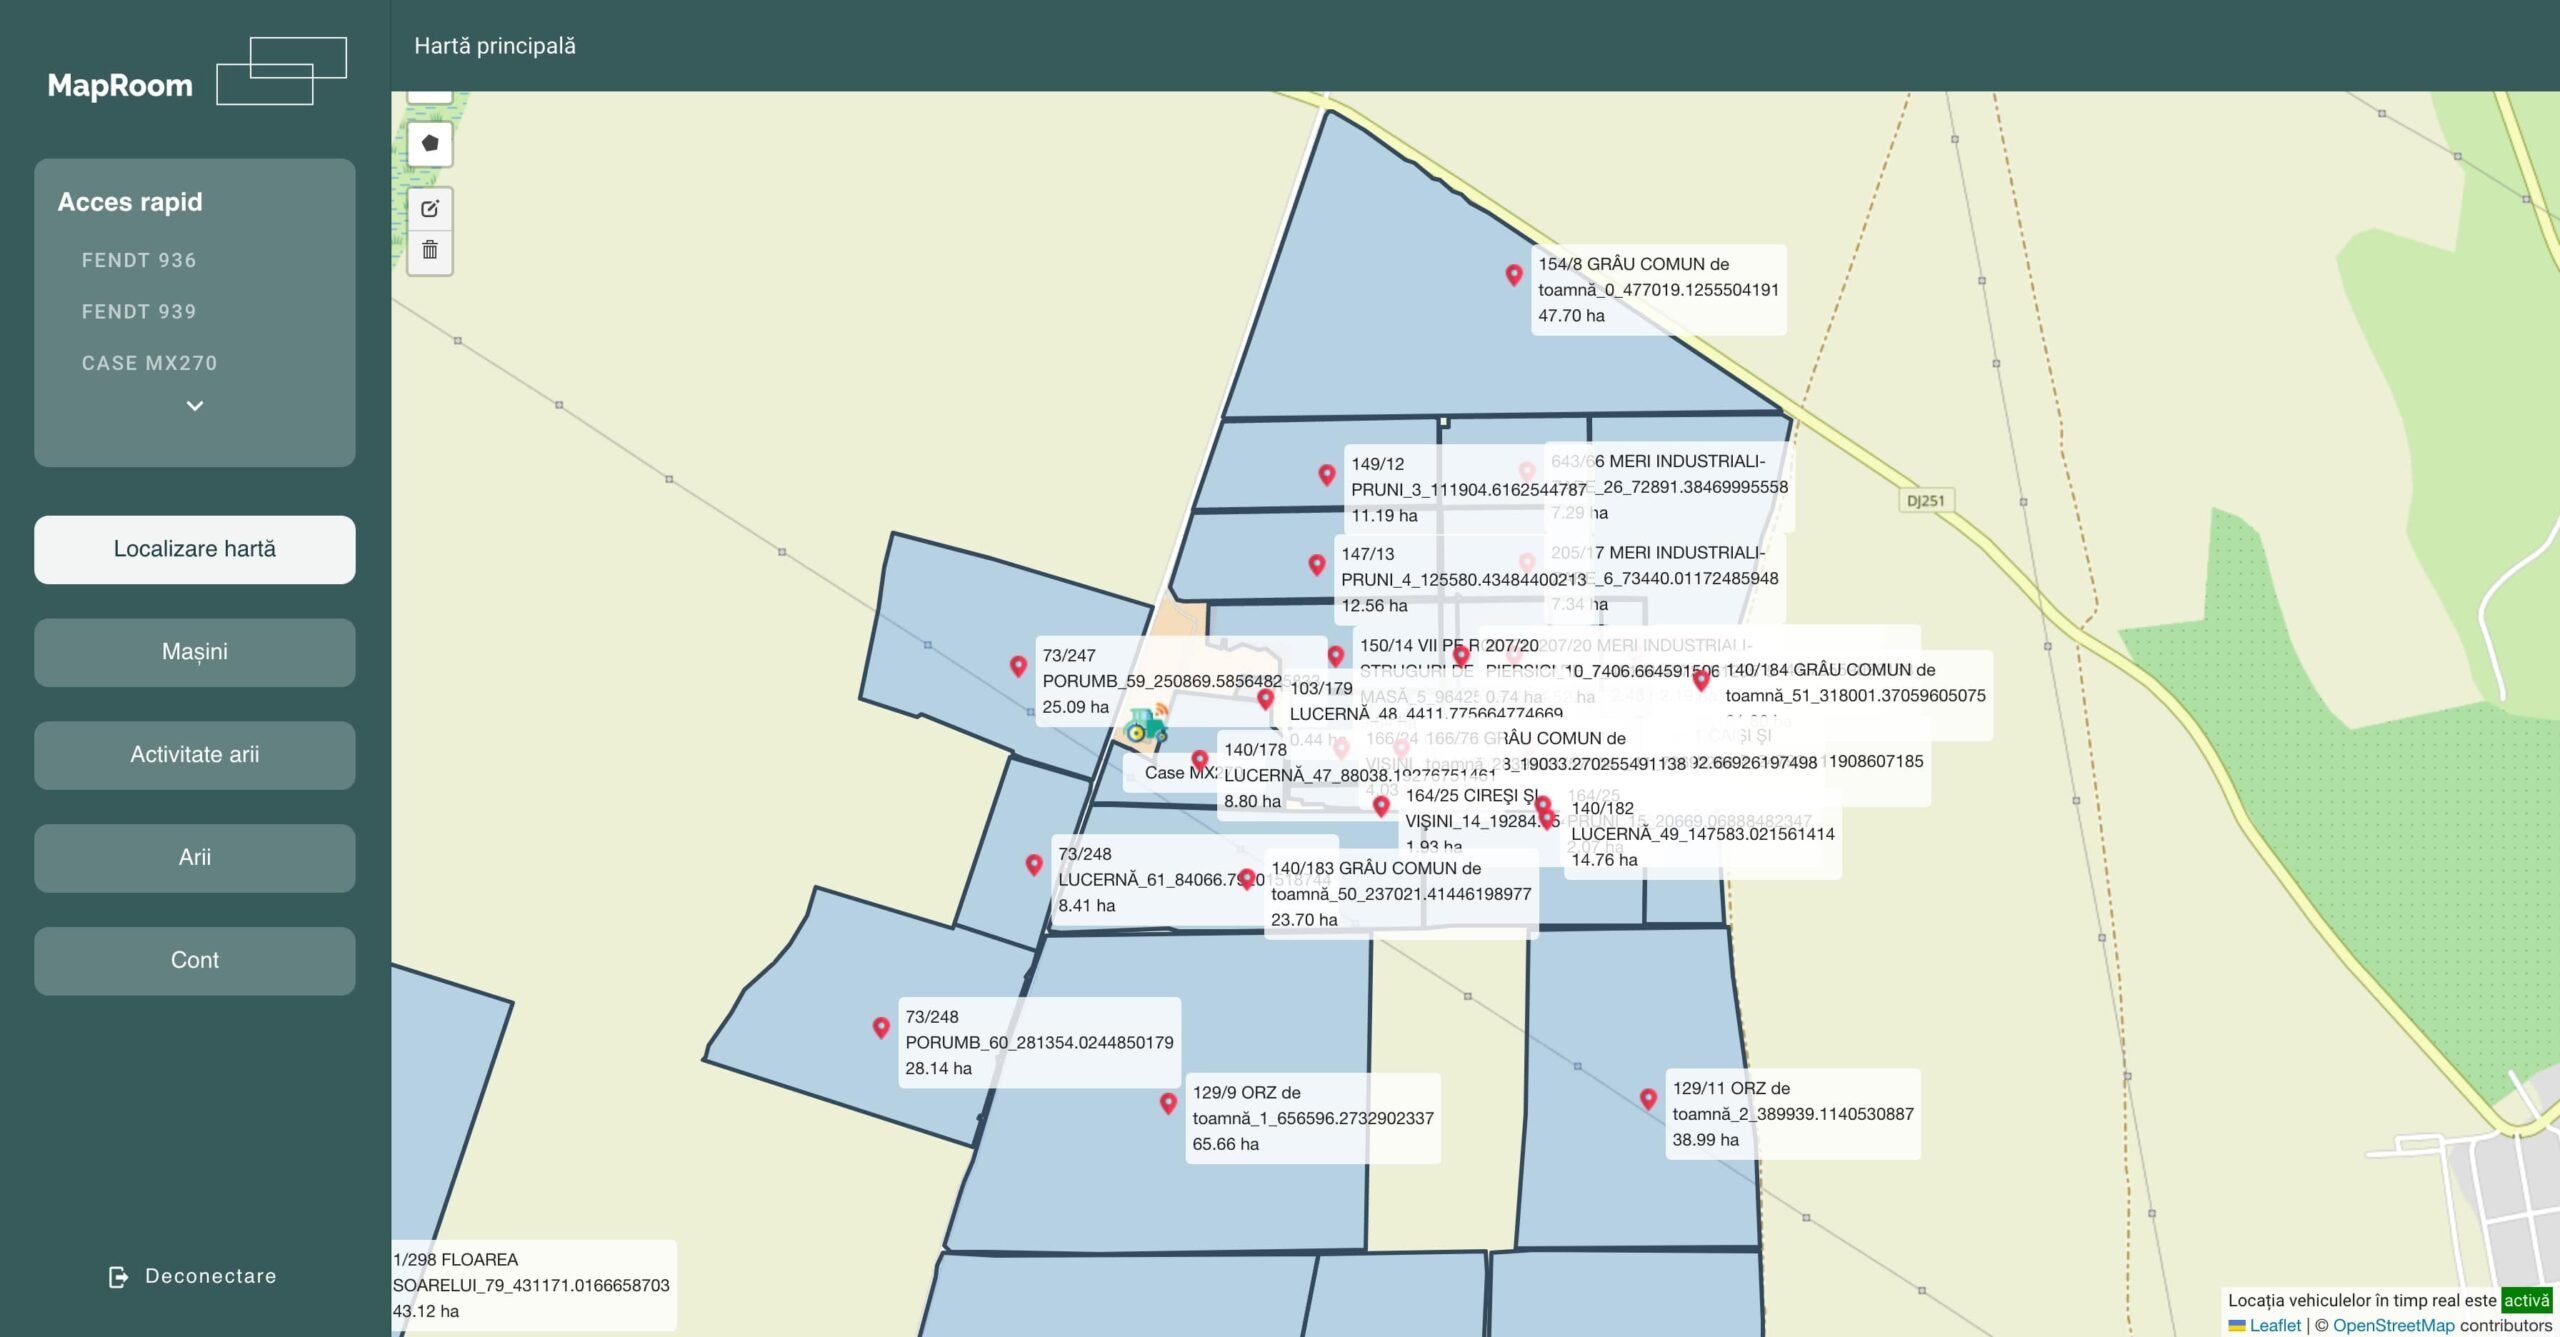
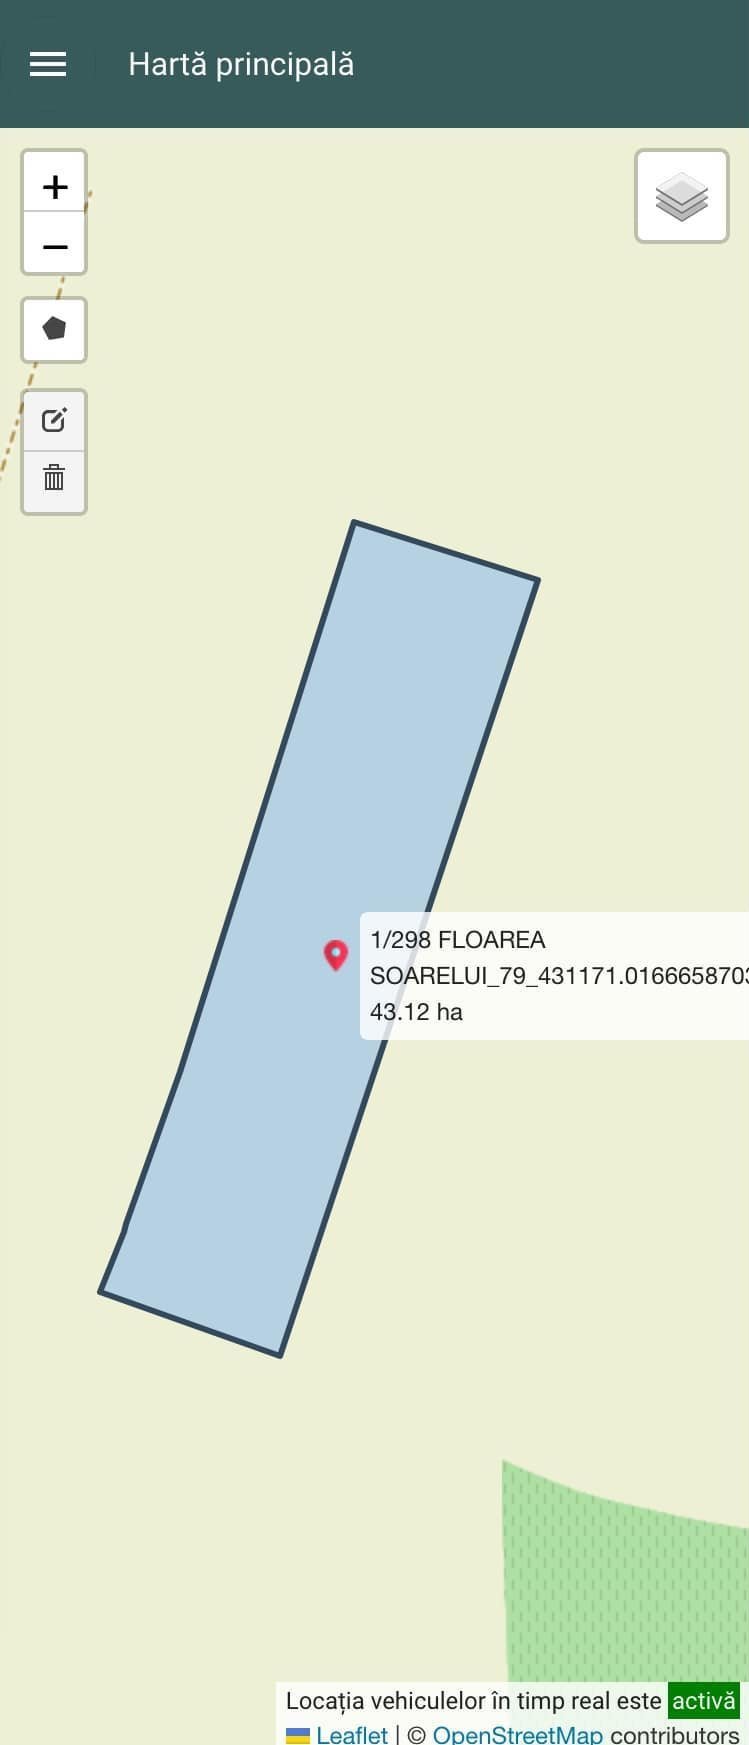
In the central part of the screen, you can see the main map, where the areas, their names, and the real-time positions of the vehicles are displayed. These elements can be shown or hidden via the button in the upper right corner. The create, edit or delete buttons can be highlighted on the left bar. These can be used to perform field operations directly from the main map in the agriculture farm management software.
The vehicle listing screen in the agriculture farm management software
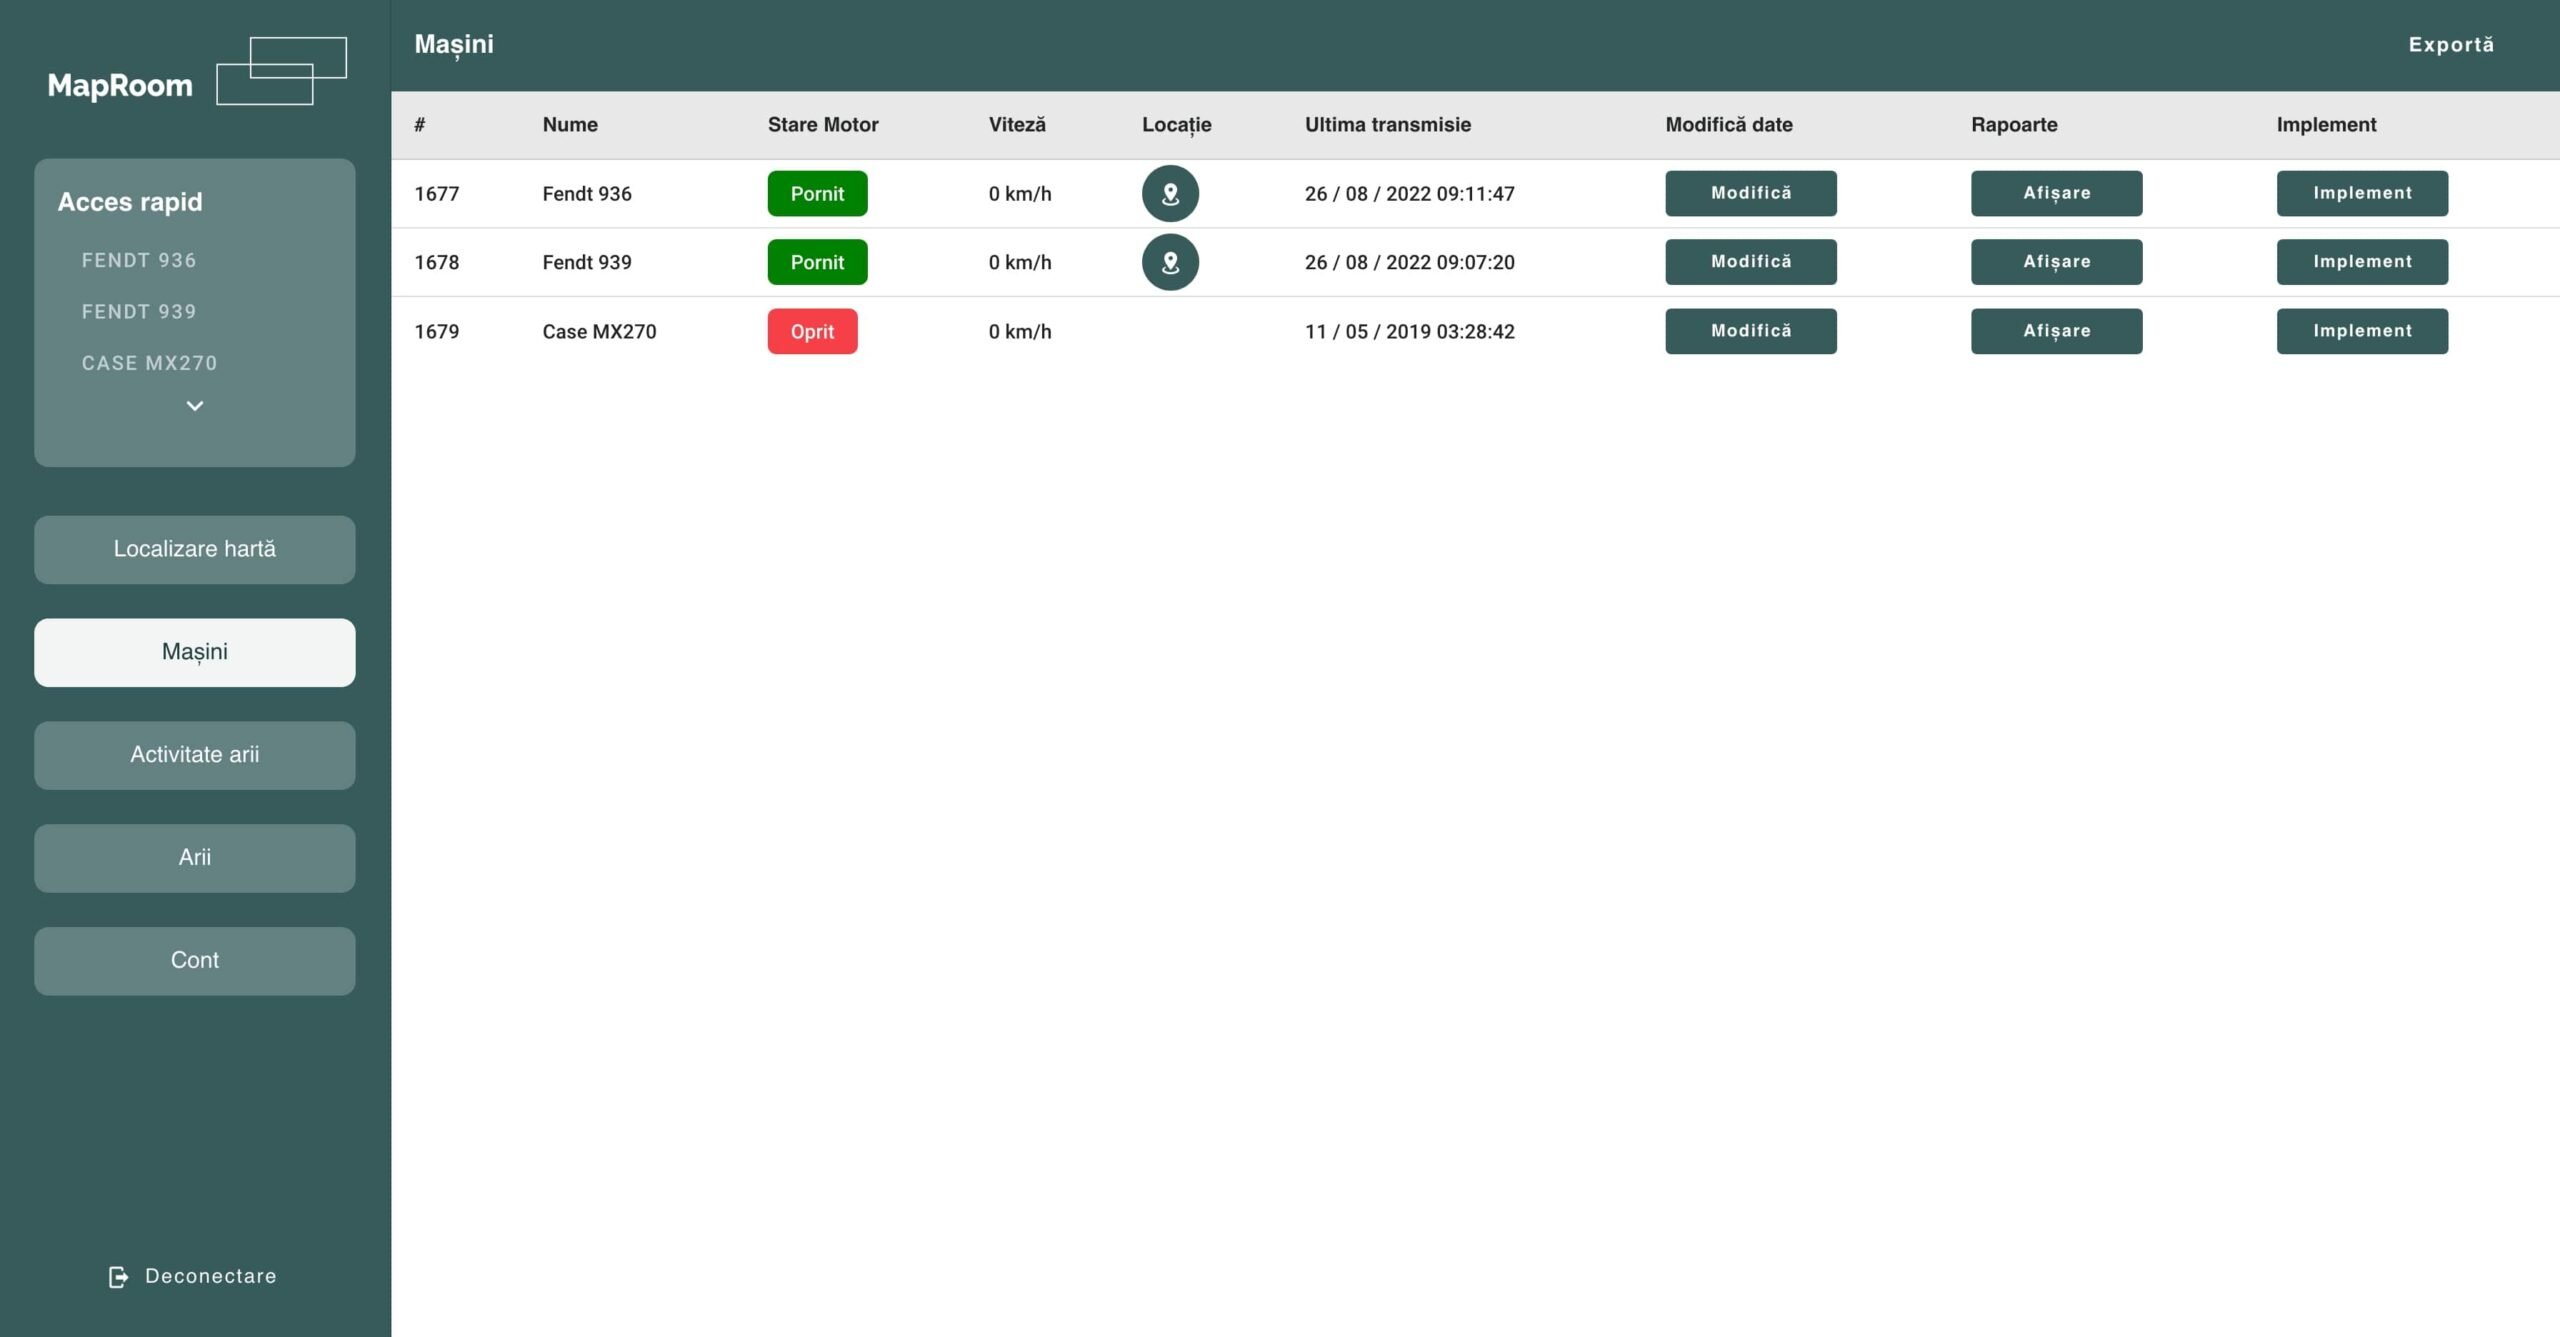
The agricultural vehicle listing screen displays information about the vehicle name, engine status, current speed, its position on the map, the date of the last transmission, and buttons that allow various operations such as: modifying vehicle data, redirecting to the screen where the vehicle reports are displayed and administration screen of the implement used.
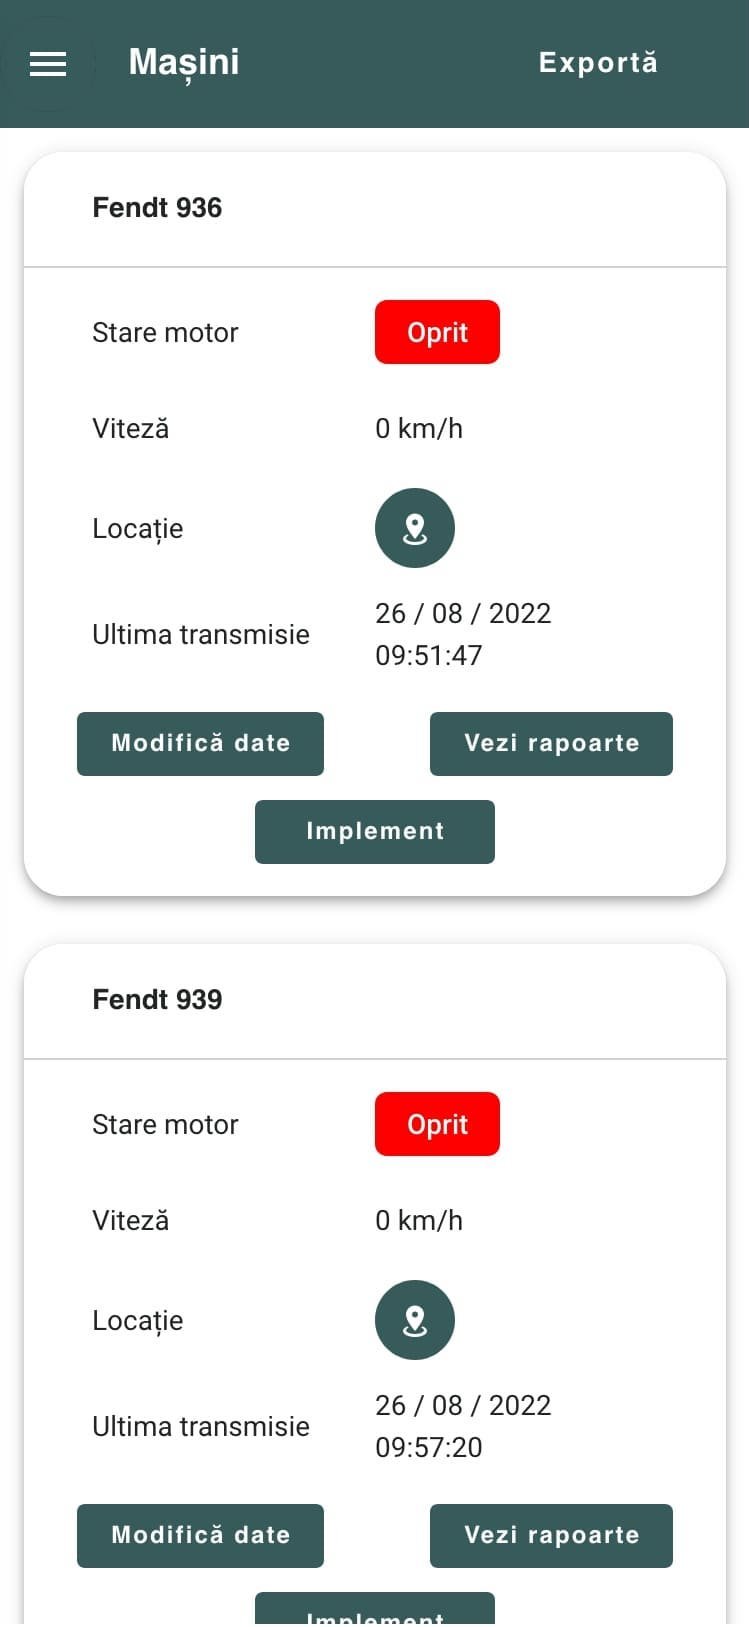
On the mobile screen of the agriculture farm management software, the design is different, as the data had to be displayed in a way that allows the farm manager to quickly access the information without having to scroll through the screen.
Modification of vehicle data
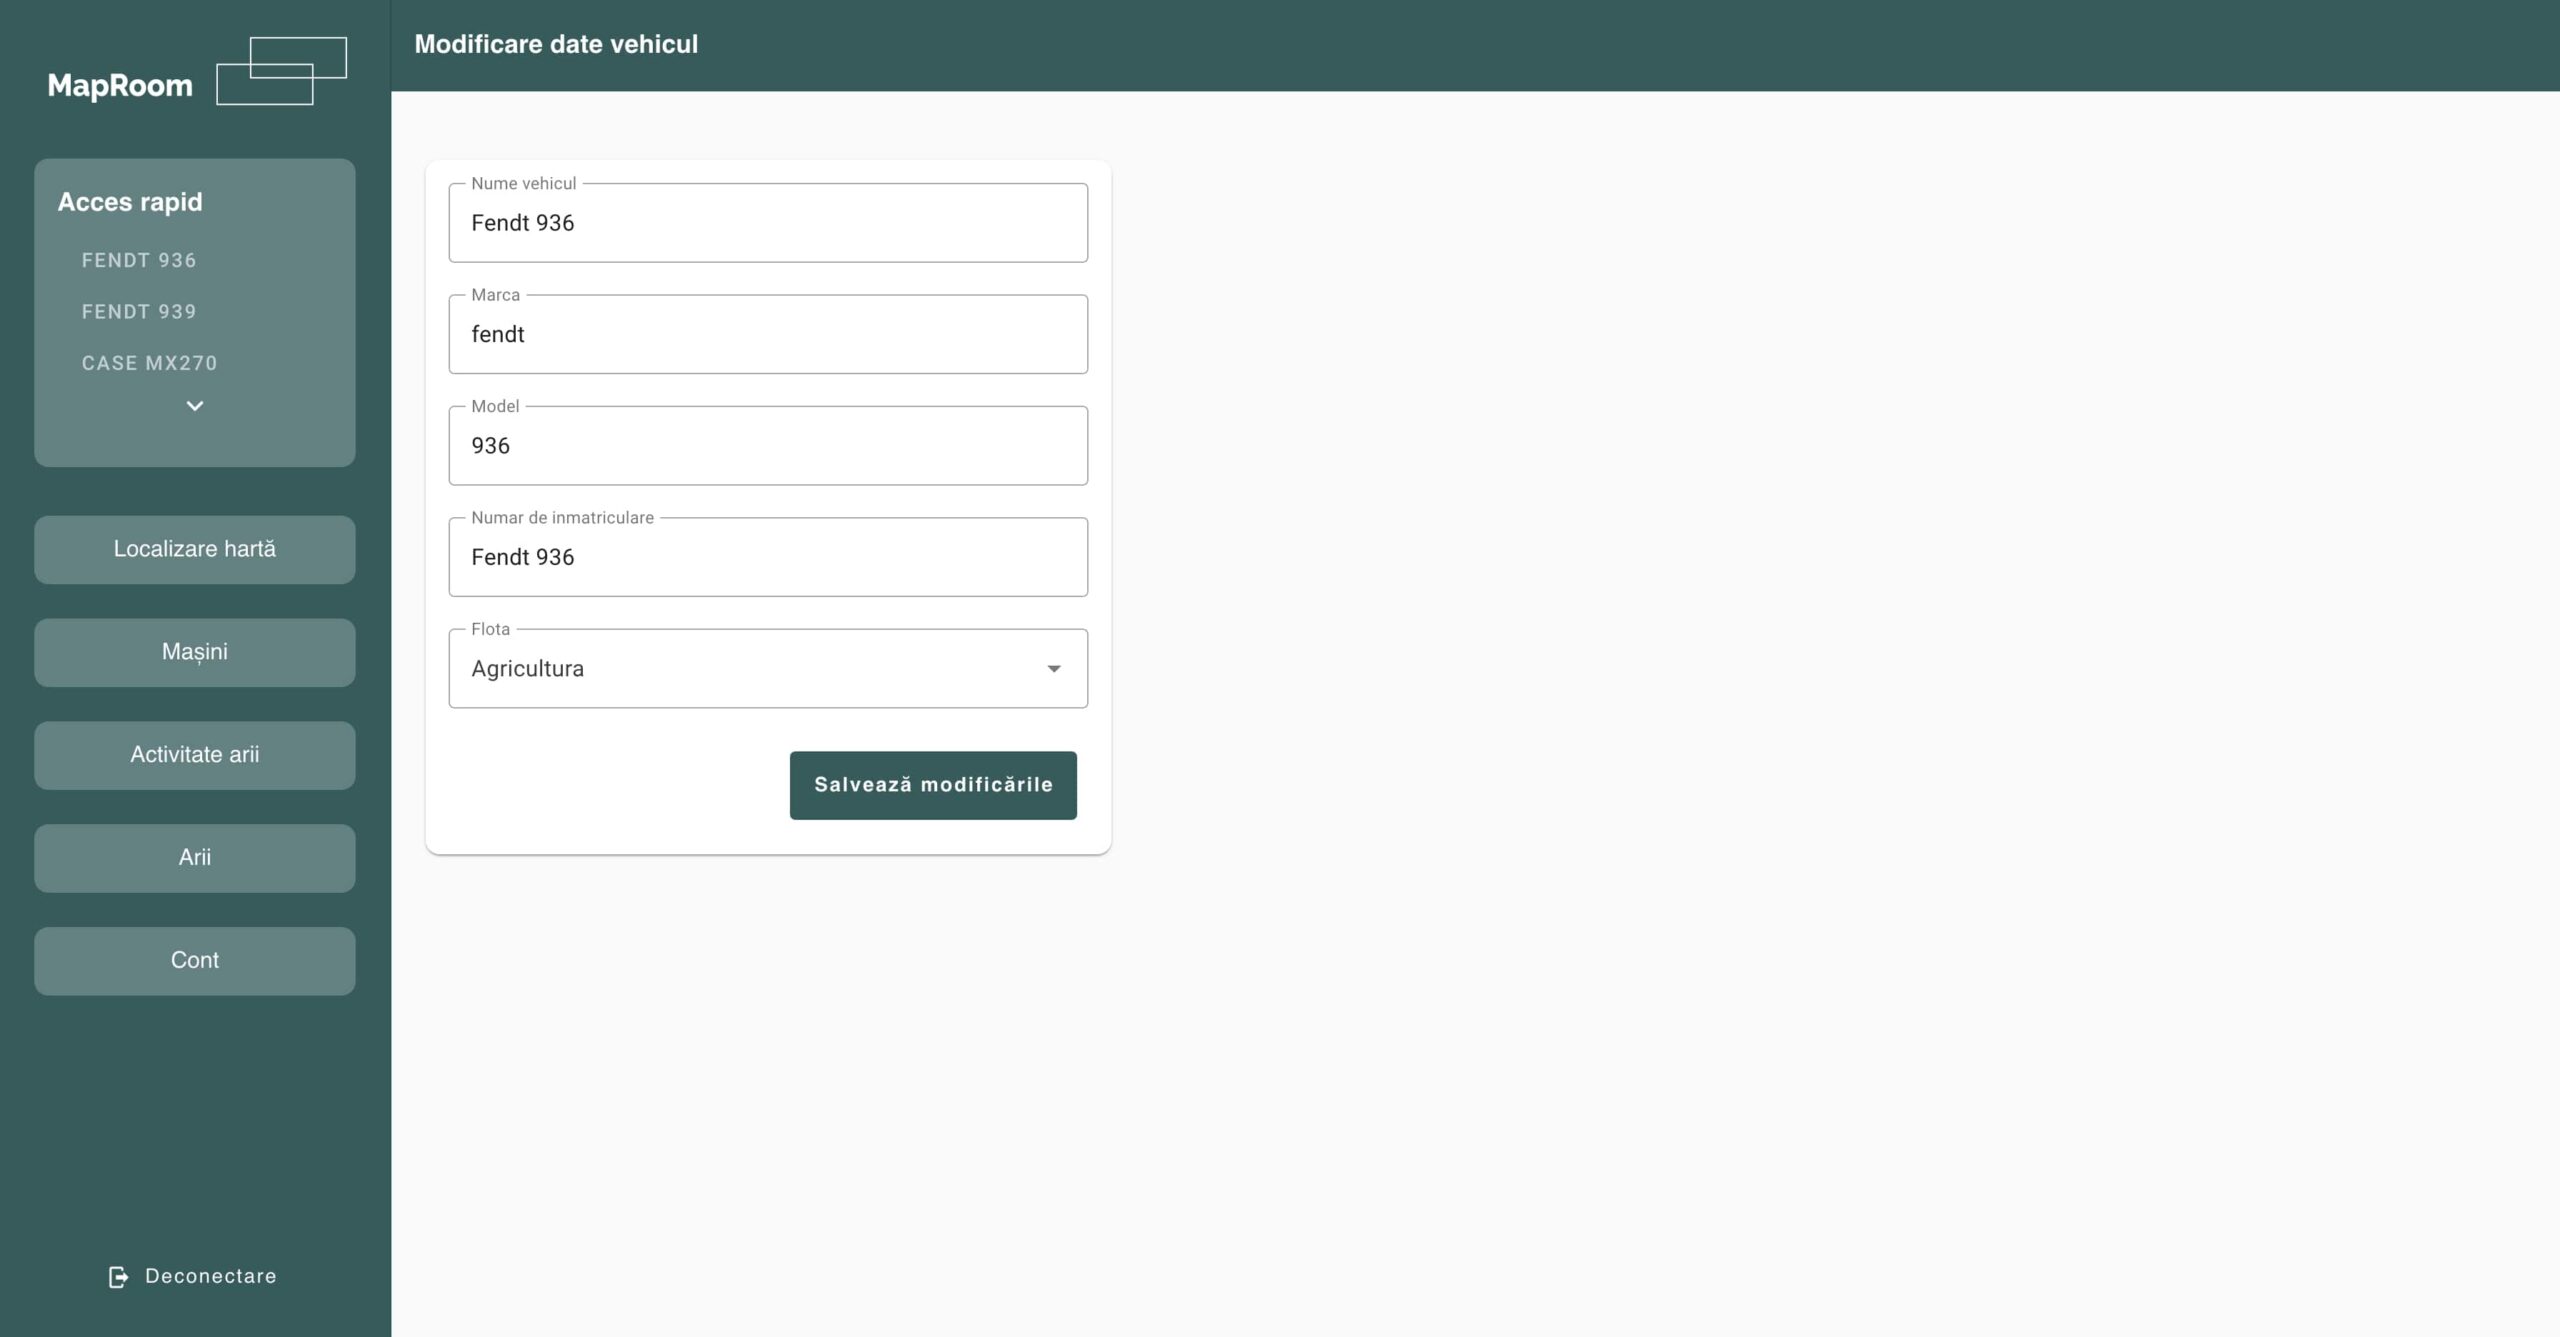
To change the data about a vehicle in the agriculture farm management software platform, you go to this screen, and later you can change the name, make, model, registration number, but also fleet it belongs to.
Implement management
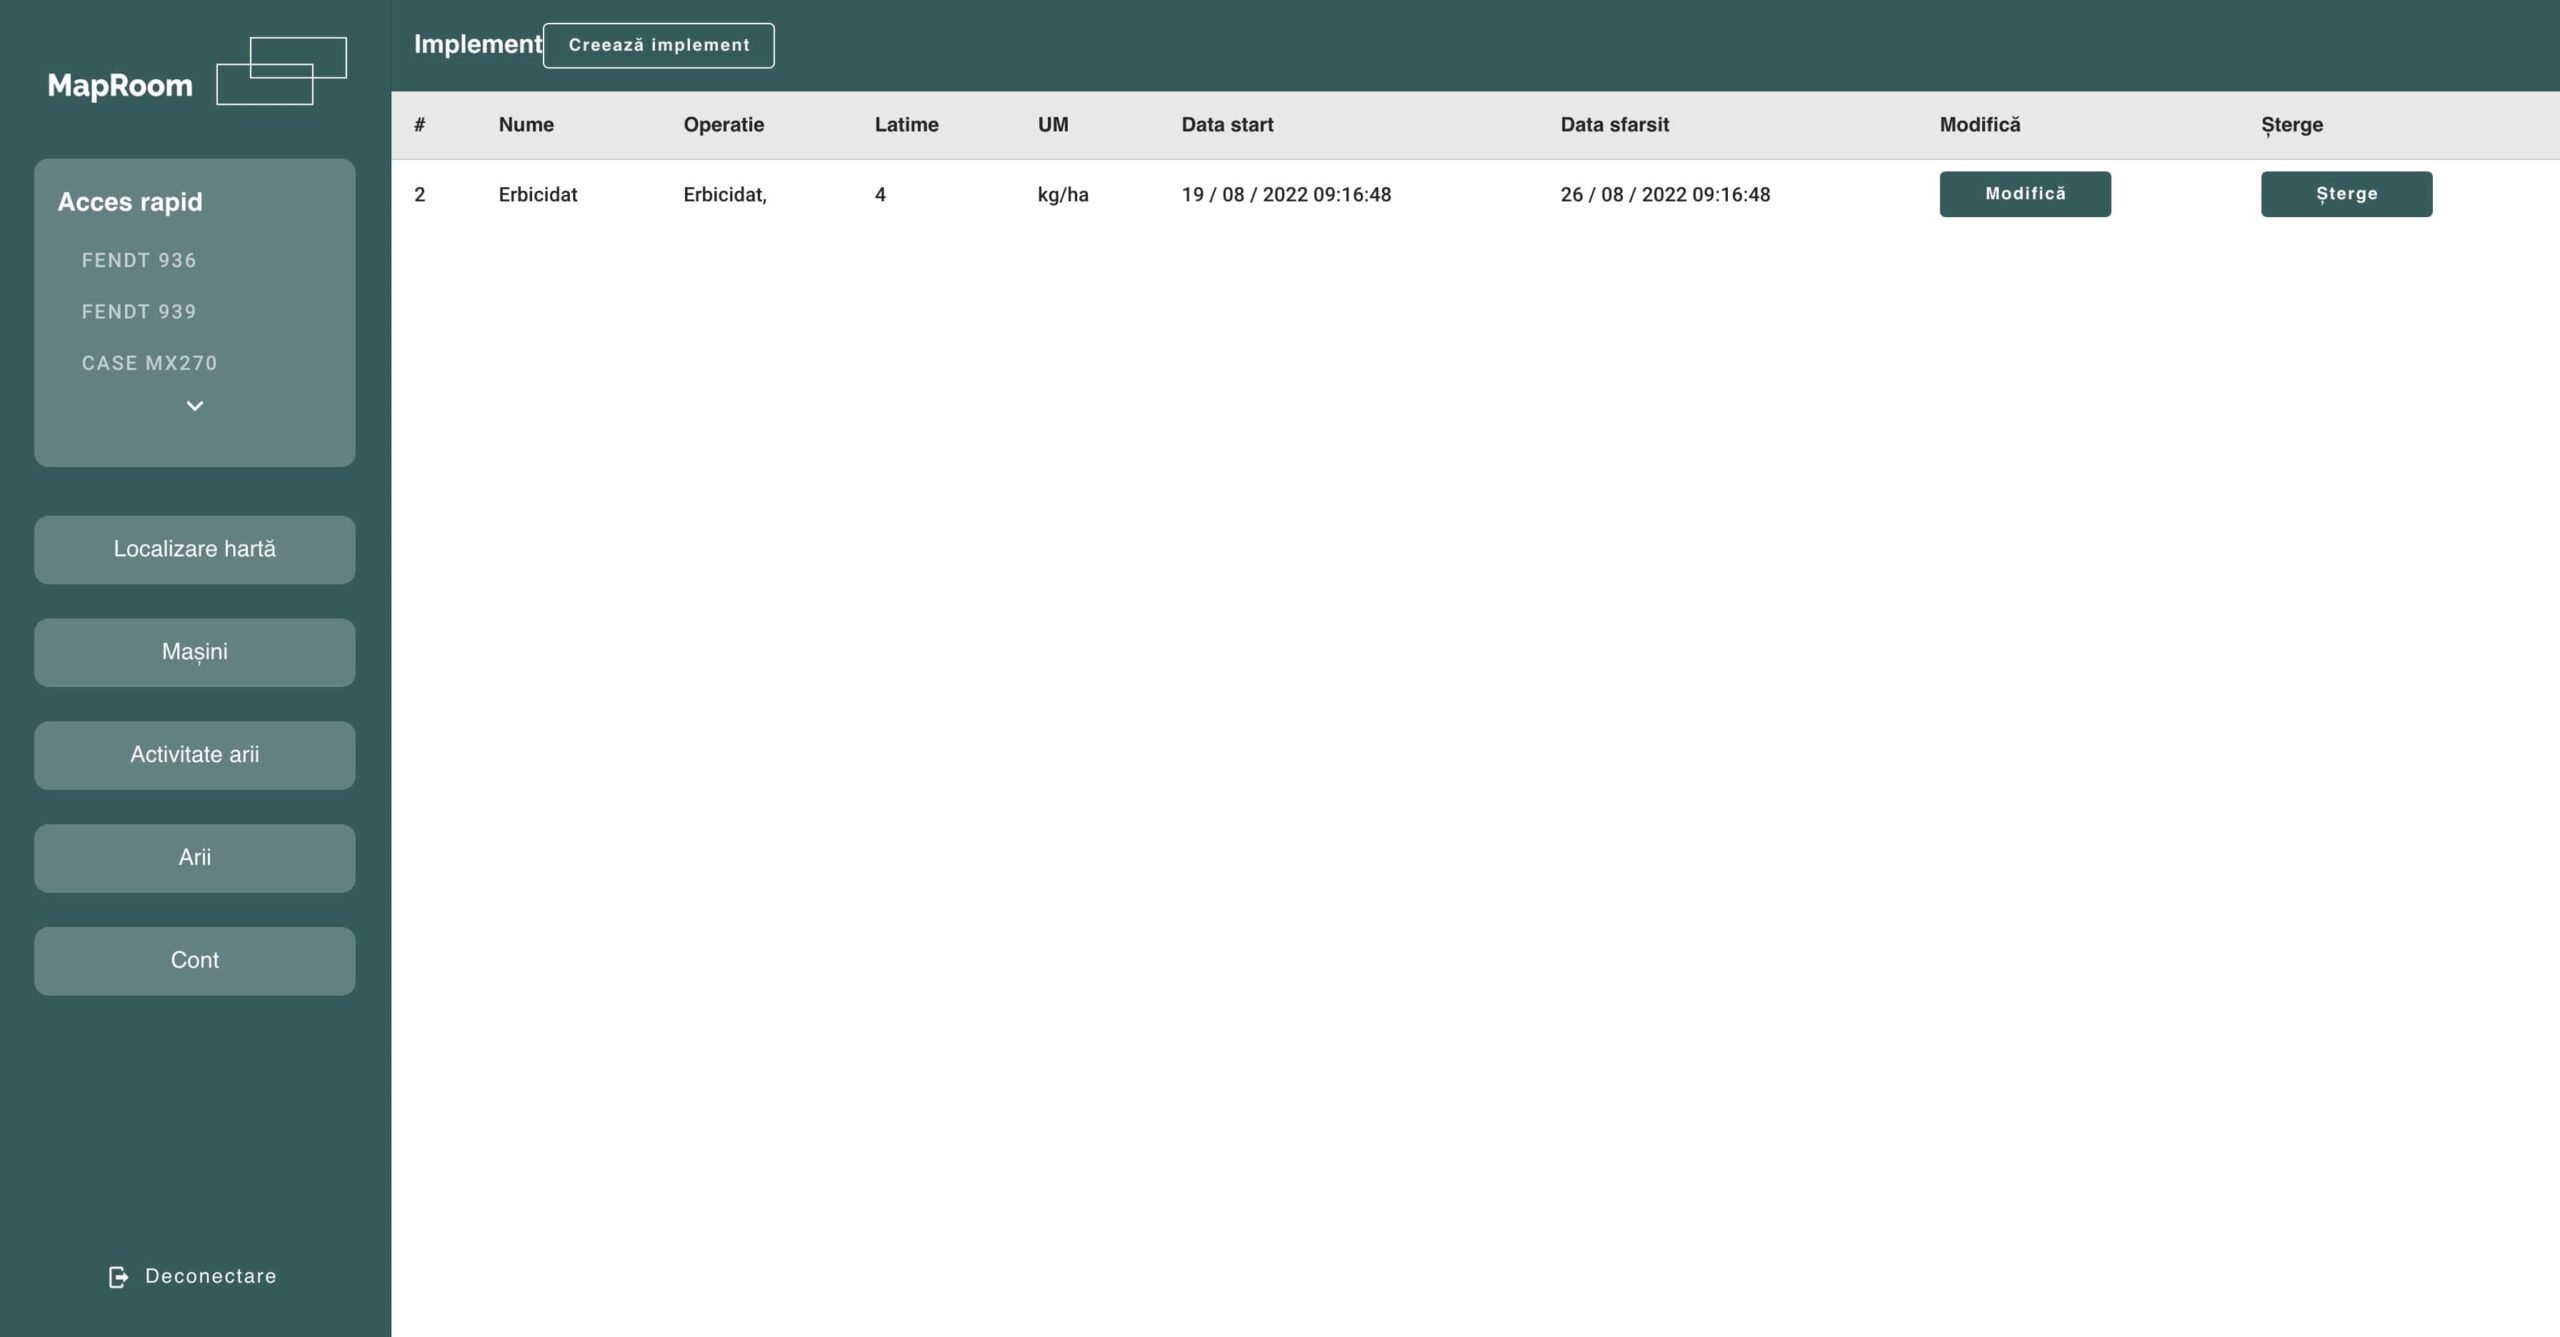
In order to be able to make complex reports and to inform the farmer as best as possible, the implement used to carry out agricultural operations can be added for each vehicle, over a period of time. Once this option is used, new data and calculations are entered into the reports. Adding a new implement is done using the Create Implement button on the menu bar.
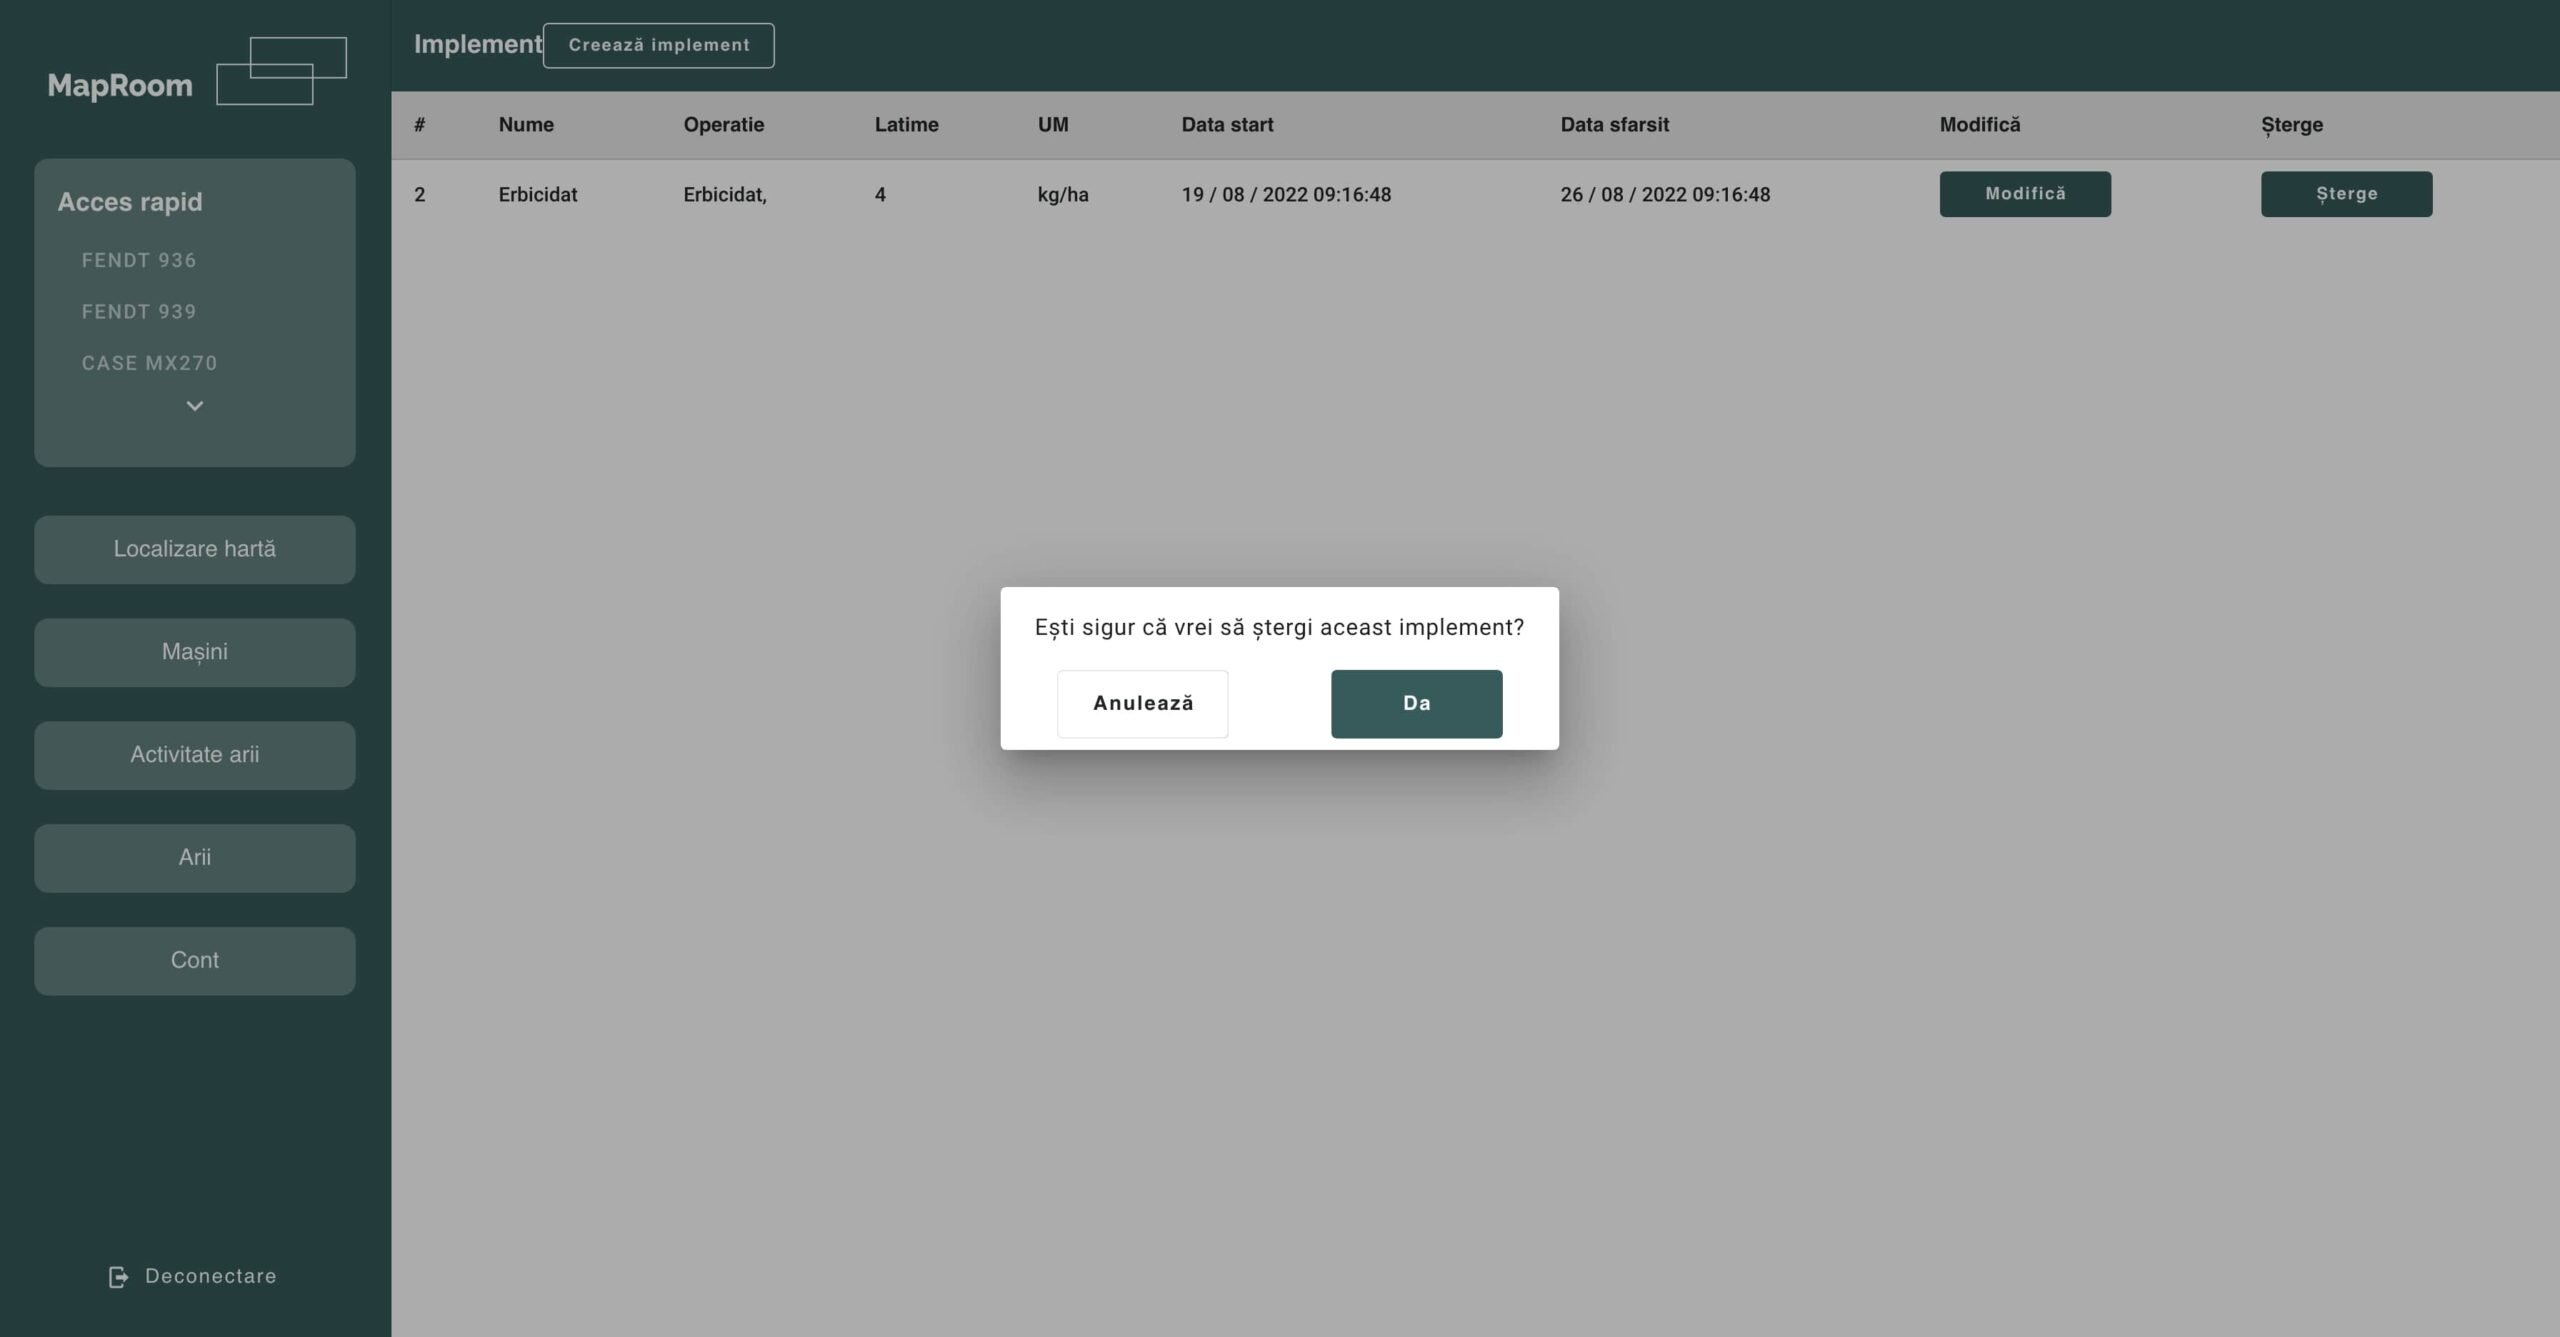
To delete an item in the agriculture farm management software platform, each time the Delete button is pressed, a confirmation popup will be displayed on the screen. The user can choose to cancel the operation or confirm the deletion.
Reports of a vehicle
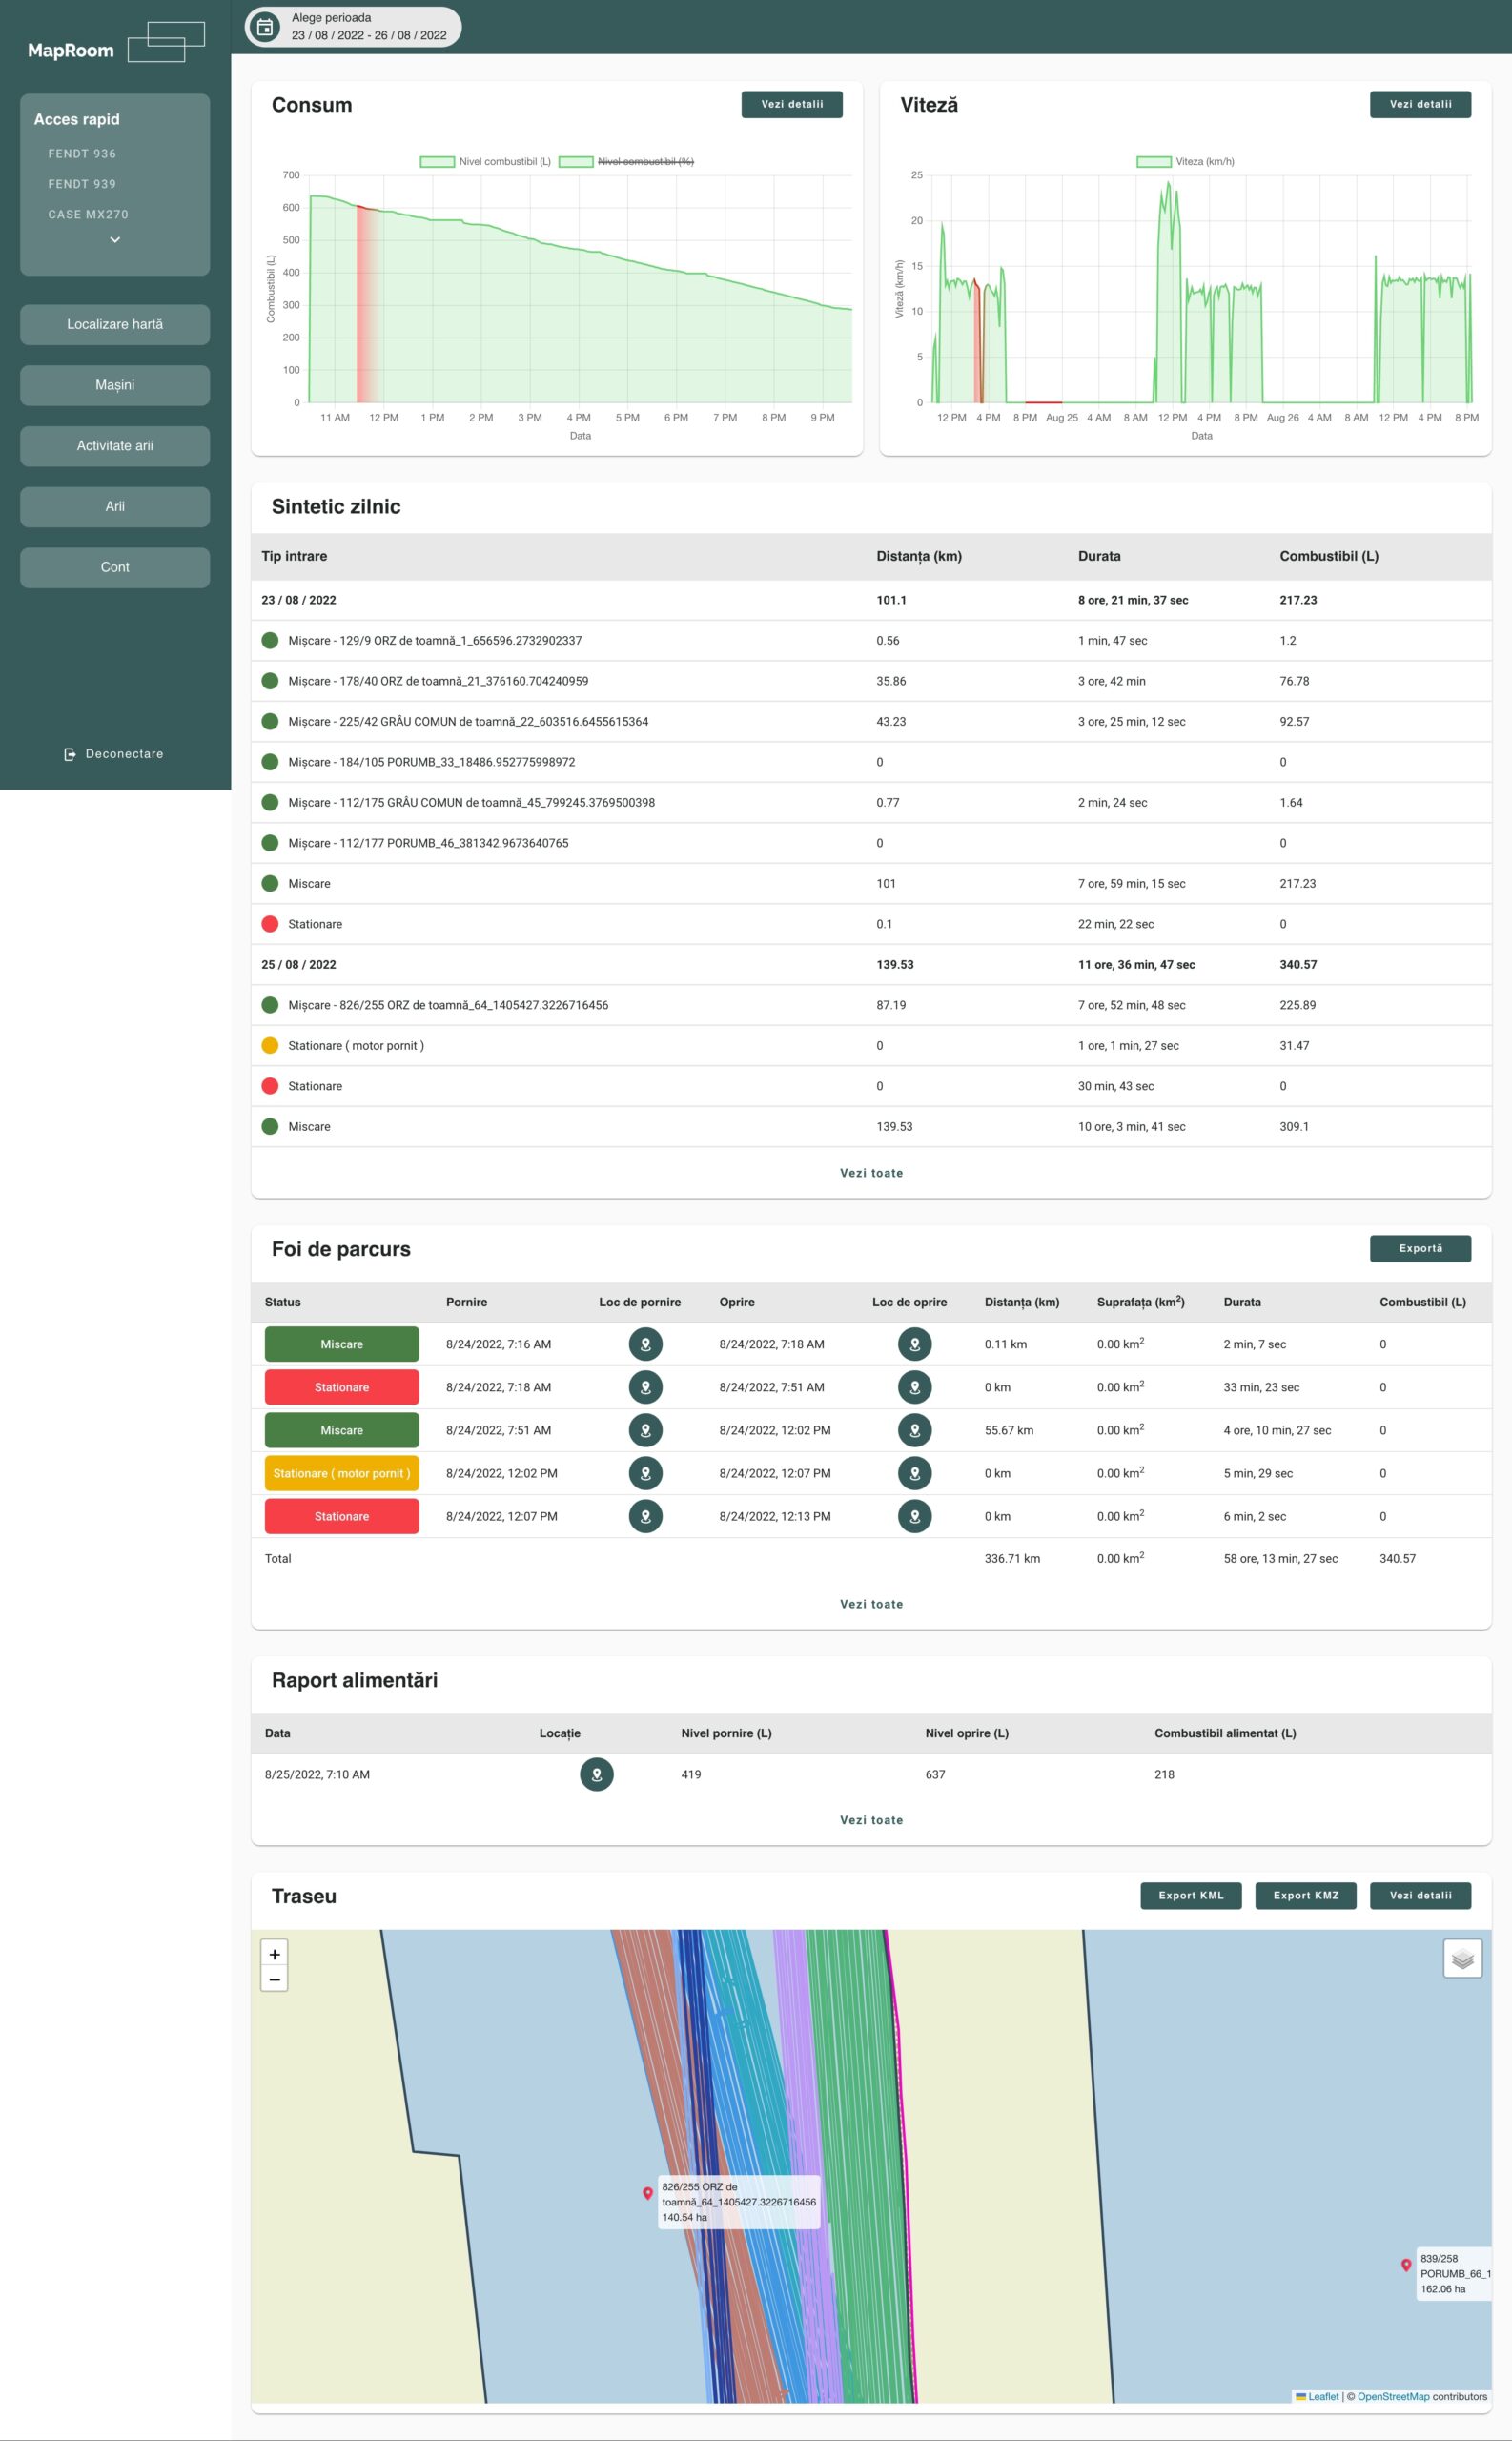
In the report screen of a vehicle, the necessary information can be found to analyze the activity of an agricultural vehicle in the agriculture farm management software platform. Thus, the agriculture farm management software platform helps farmers to check the statistics and understand what are the strengths and where are weaknesses that need to be improved.
On the menu bar, at the top of the screen, the user can choose to choose the reporting period and the one in which all the reports below will be displayed.
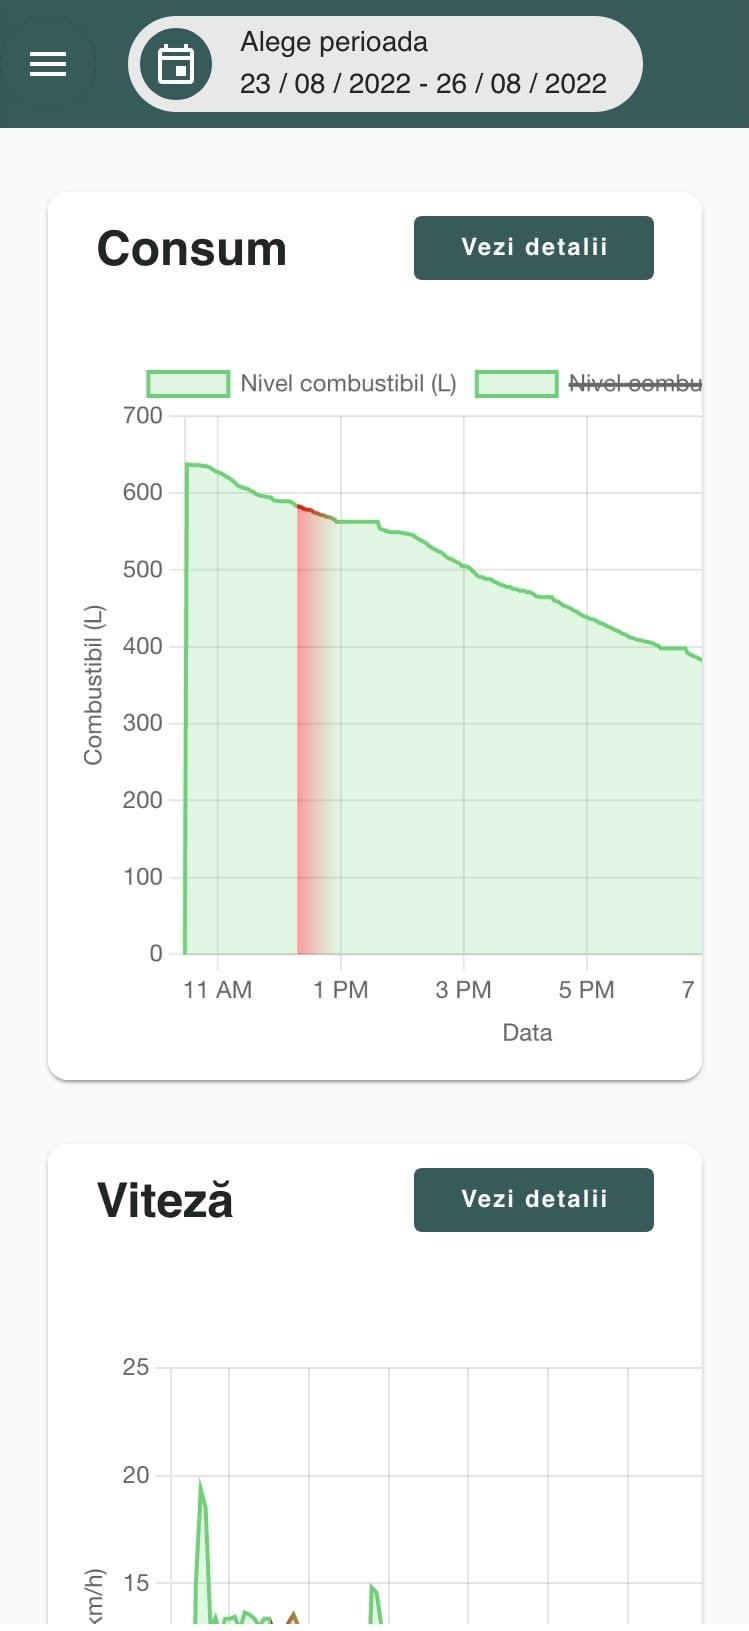
The first graph shows the consumption in liters or in percentages. The green color symbolizes the fact that the engine is started, and the red part shows that the engine has been stopped. By clicking on the See details button, the graph will be displayed in full-screen mode. The main advantage of fuel analysis is to identify losses or in unpleasant cases thefts.
The speed graph displays the speed history of the selected vehicle. The major benefit that this graph brings to the farm manager is to identify whether the tractor driver has followed the correct running speeds according to the farming operation he has carried out. This graph can also be displayed in full-screen mode, by clicking on See details.
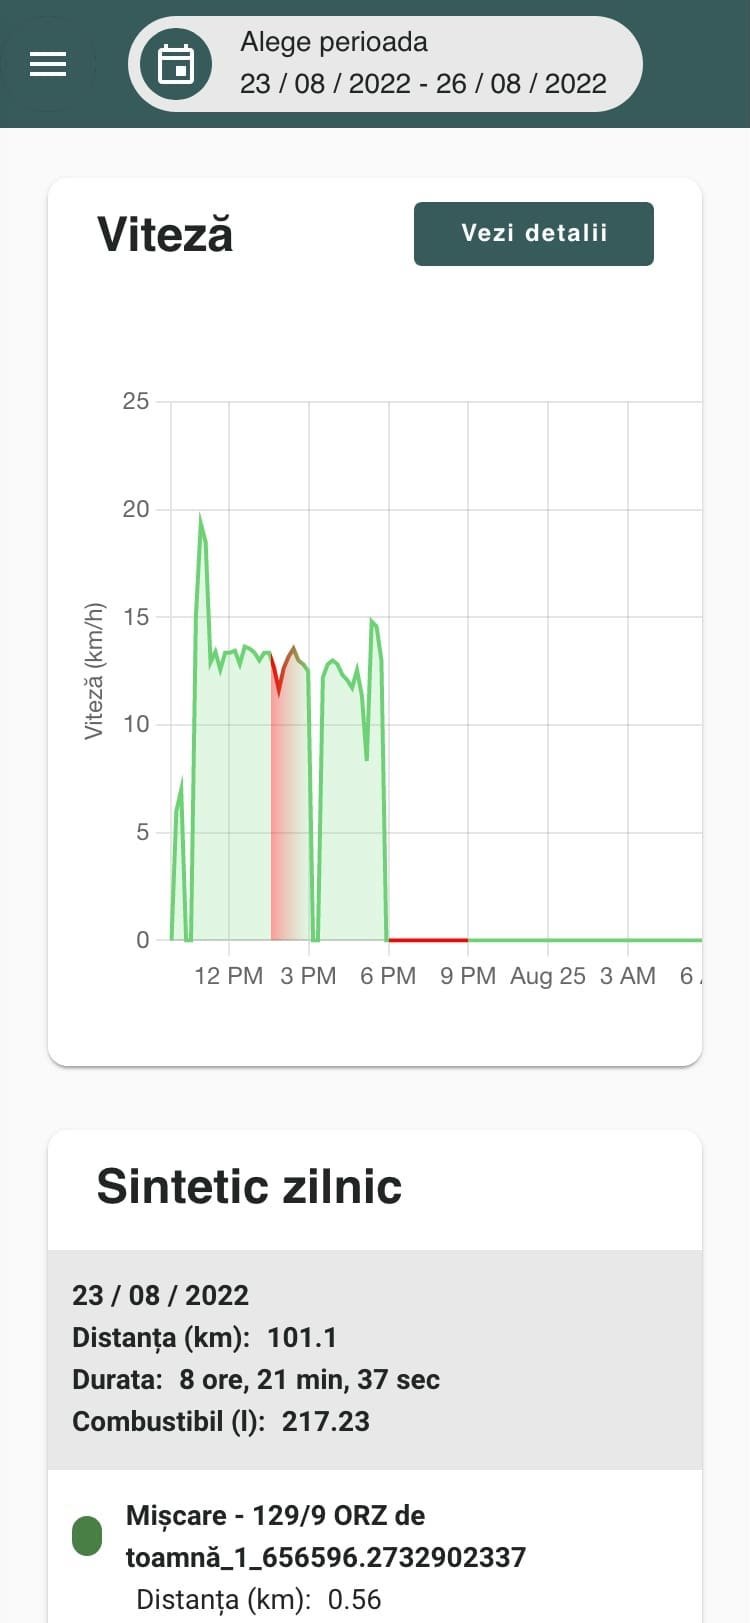
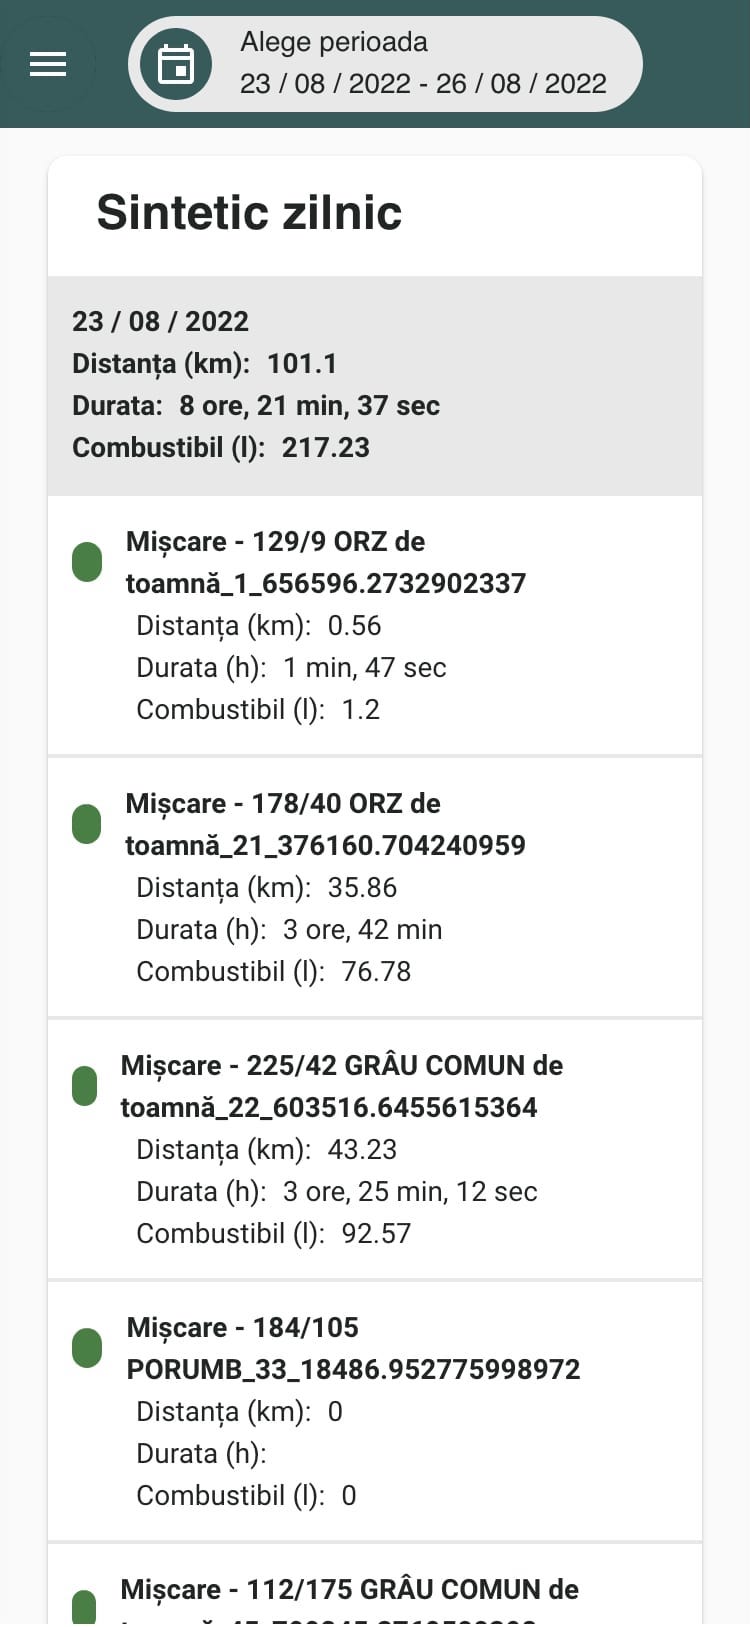
The Daily Synthetic Report represents a summary of the vehicle’s activity by day, displayed by the vehicle’s driving type (moving, stationary), areas, and the total of the day. By analyzing this chart, the farm manager can check if the planning has been followed and what is the current status of the works or check the history.
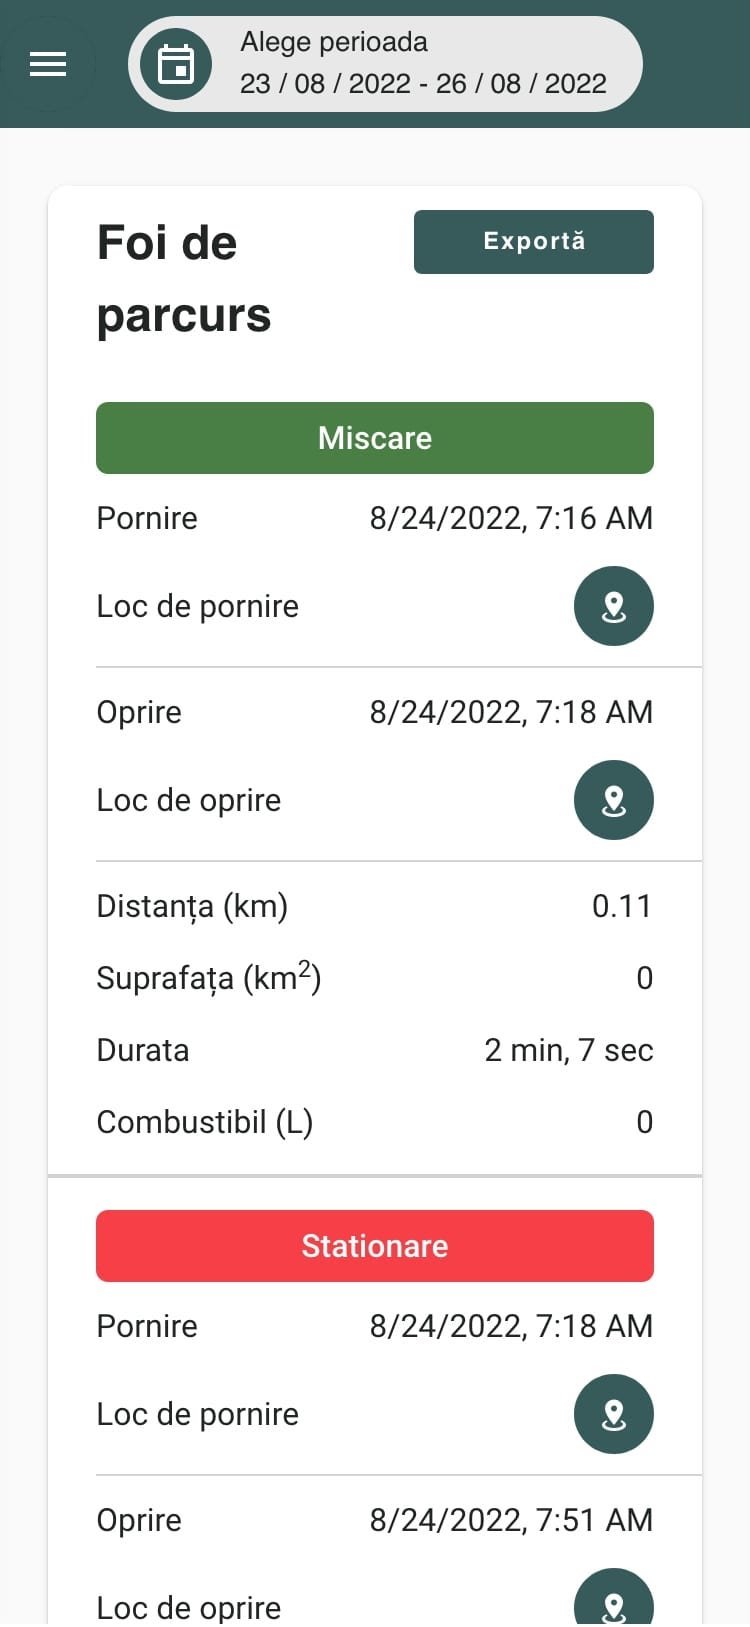
Roadmaps are a generic report for the agriculture farm management software platform by monitoring the vehicle fleet and their activity. You can see the status of the activity, the time and place of the position where the engine was started but also stopped, the distance traveled in km, the area covered by the vehicle (only if the vehicle has added an implement for the current reporting period), the duration and the fuel consumed. This report can also be exported to Excel by clicking on the Export button.
The refueling report displays the history of refueling by showing the date, location, and level of fuel added.
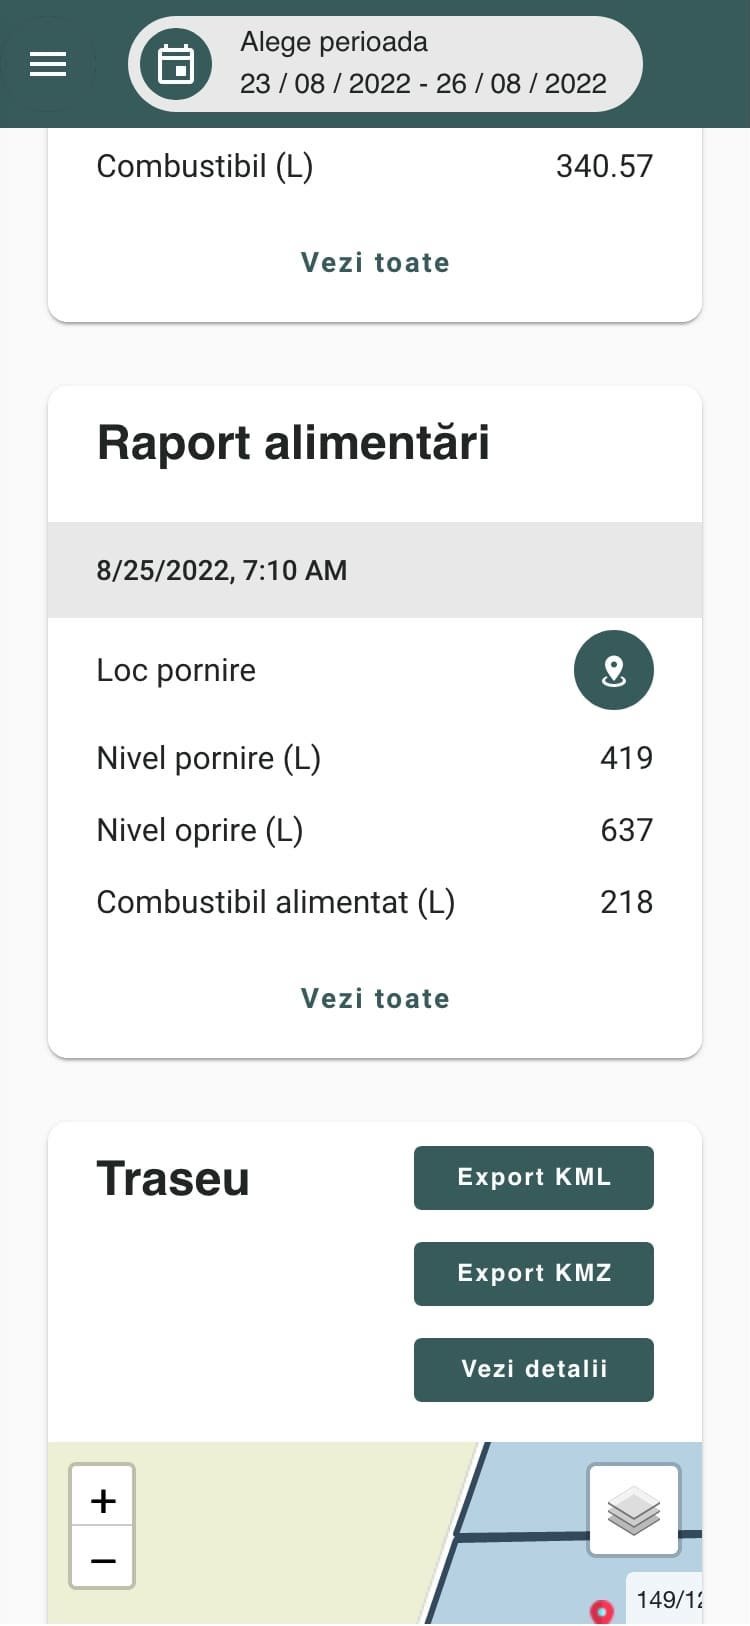
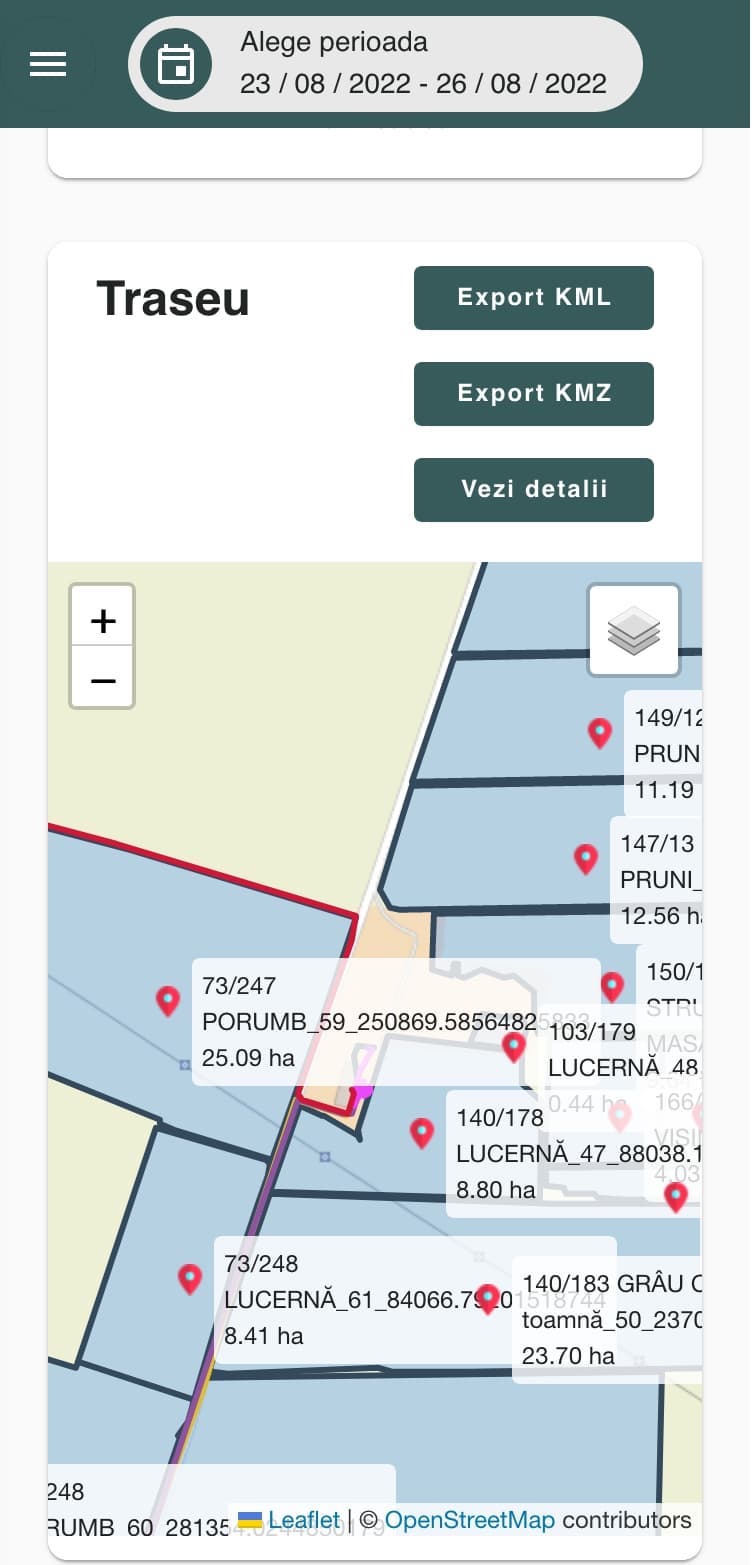
The last report displayed on the page is that of the route traveled. The route traveled during the selected reporting period is displayed on the map. Each line drawn on the graph, which has a different color, represents a route from starting to stopping the engine. In order to be able to use the data listed in the application, the farmer has at his disposal in the agriculture farm management software platform, the export of data in KML, KMZ, or excel formats.
Area listing screen
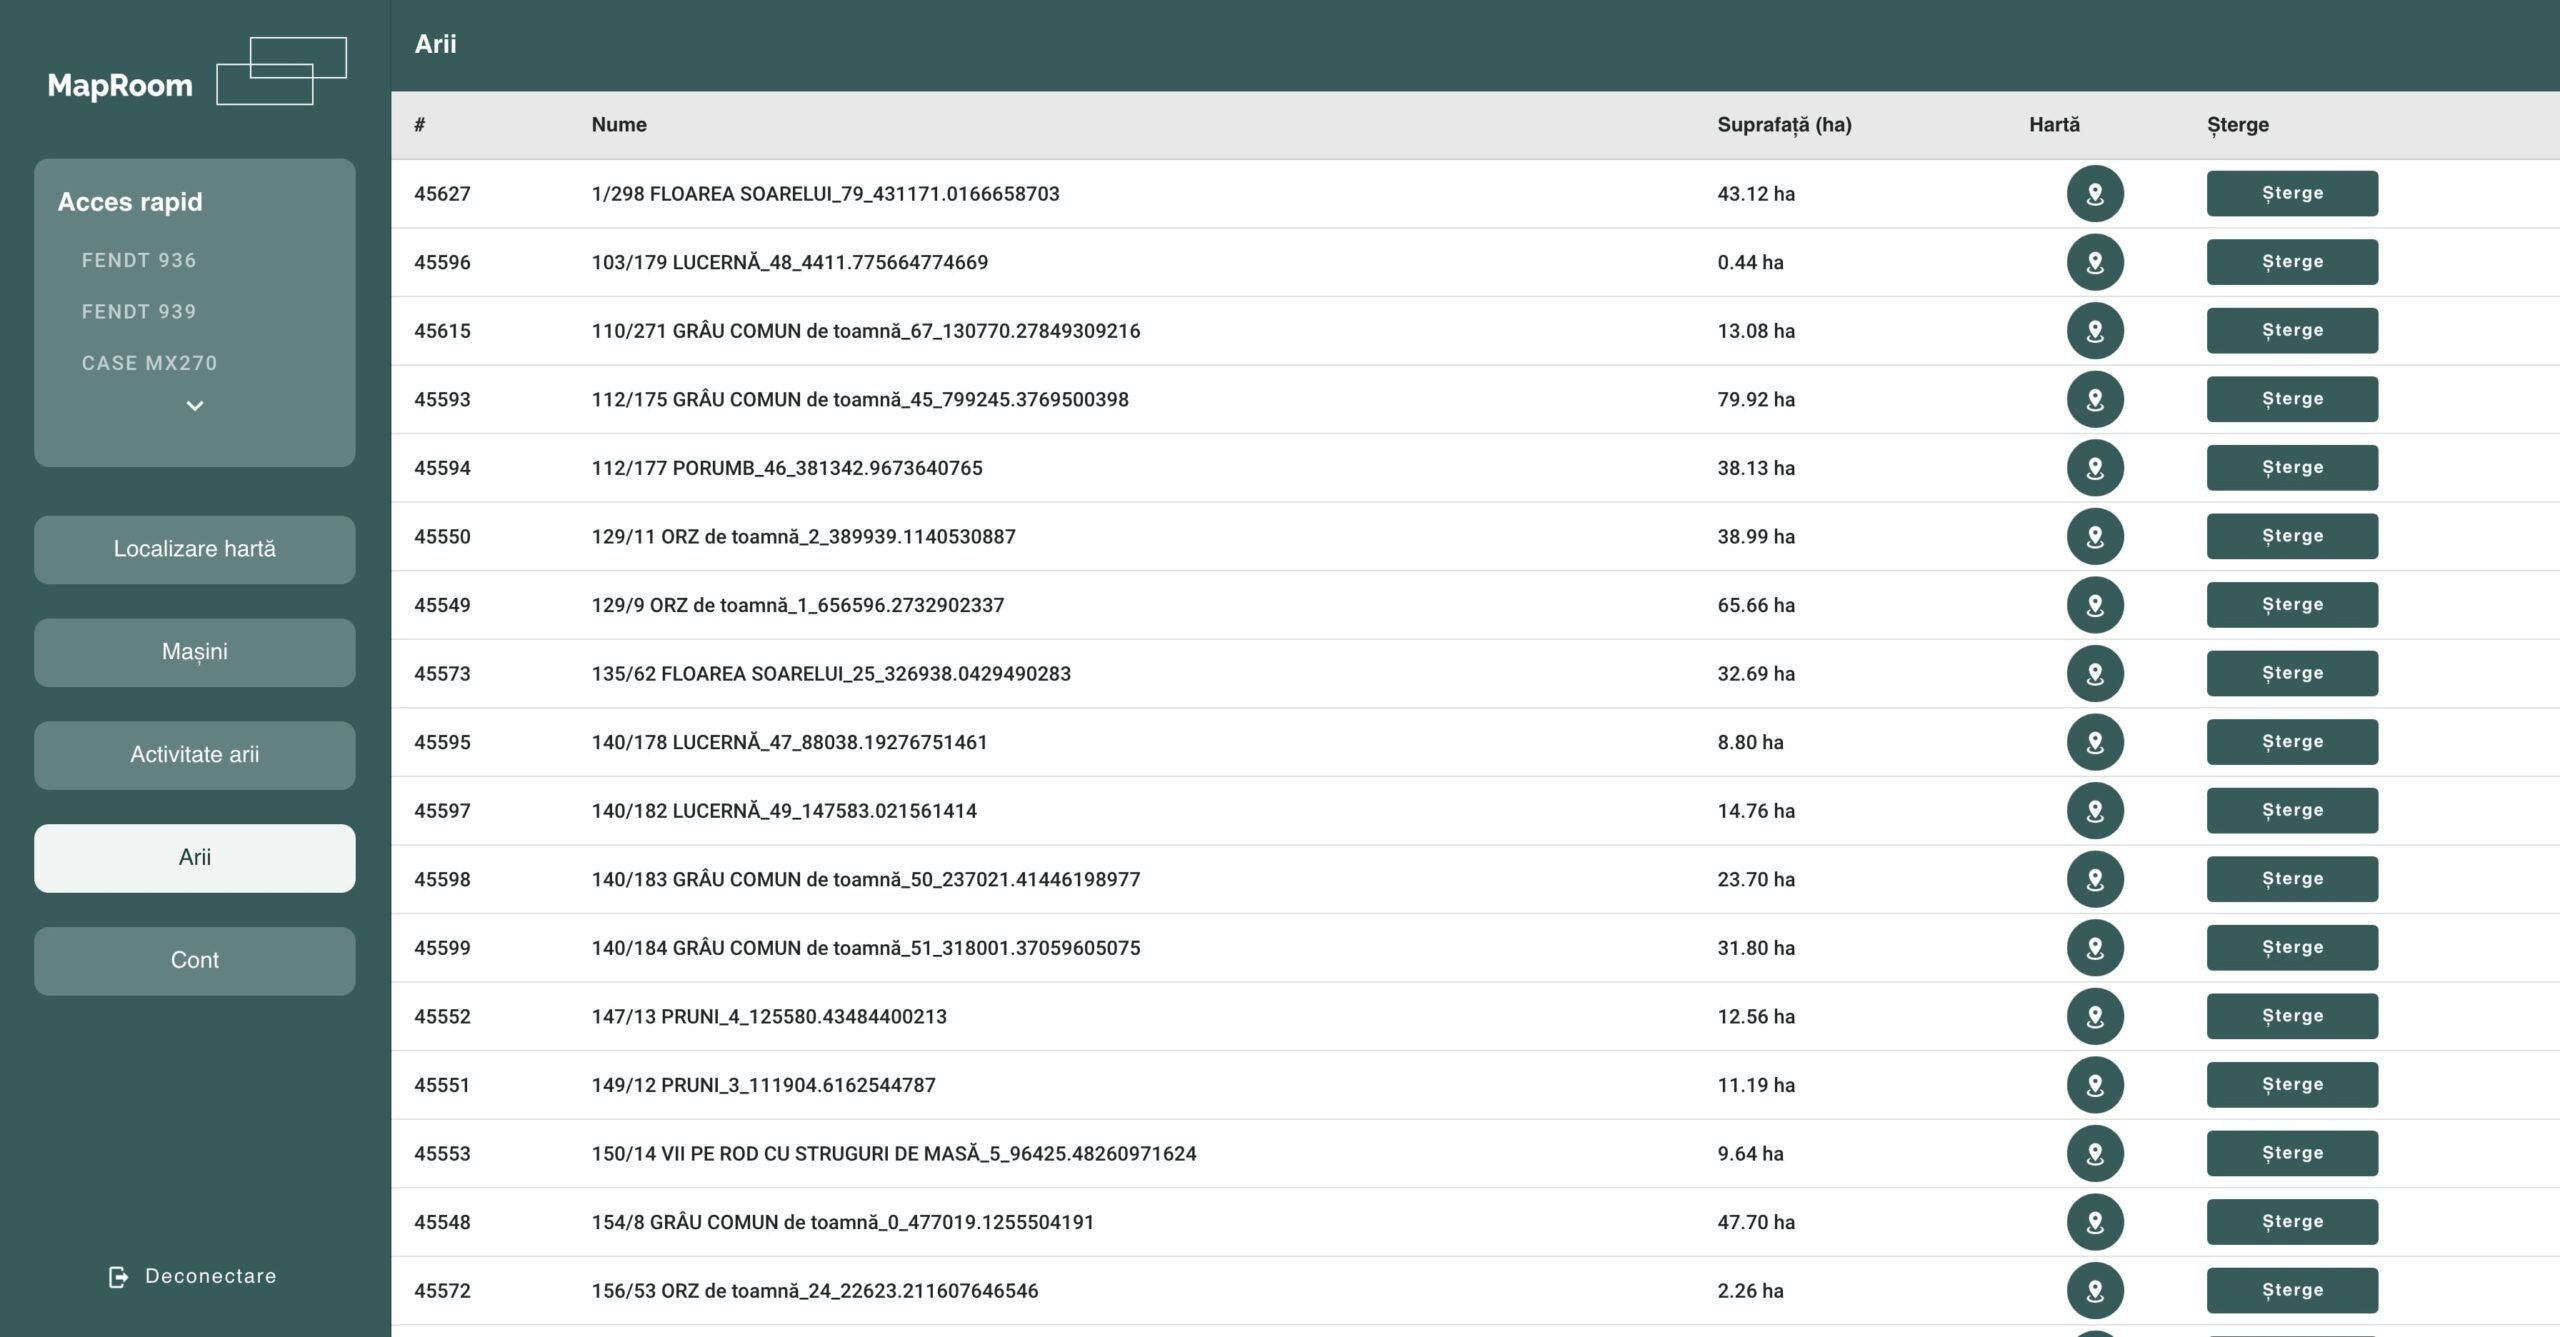
Area management is mostly done from the main map screen in the agriculture farm management software platform. But there was a need for a viewing screen in list mode, where the farm manager can see the areas, and their surface can click on the map button to display them on the map, and click on delete, to give up an area.
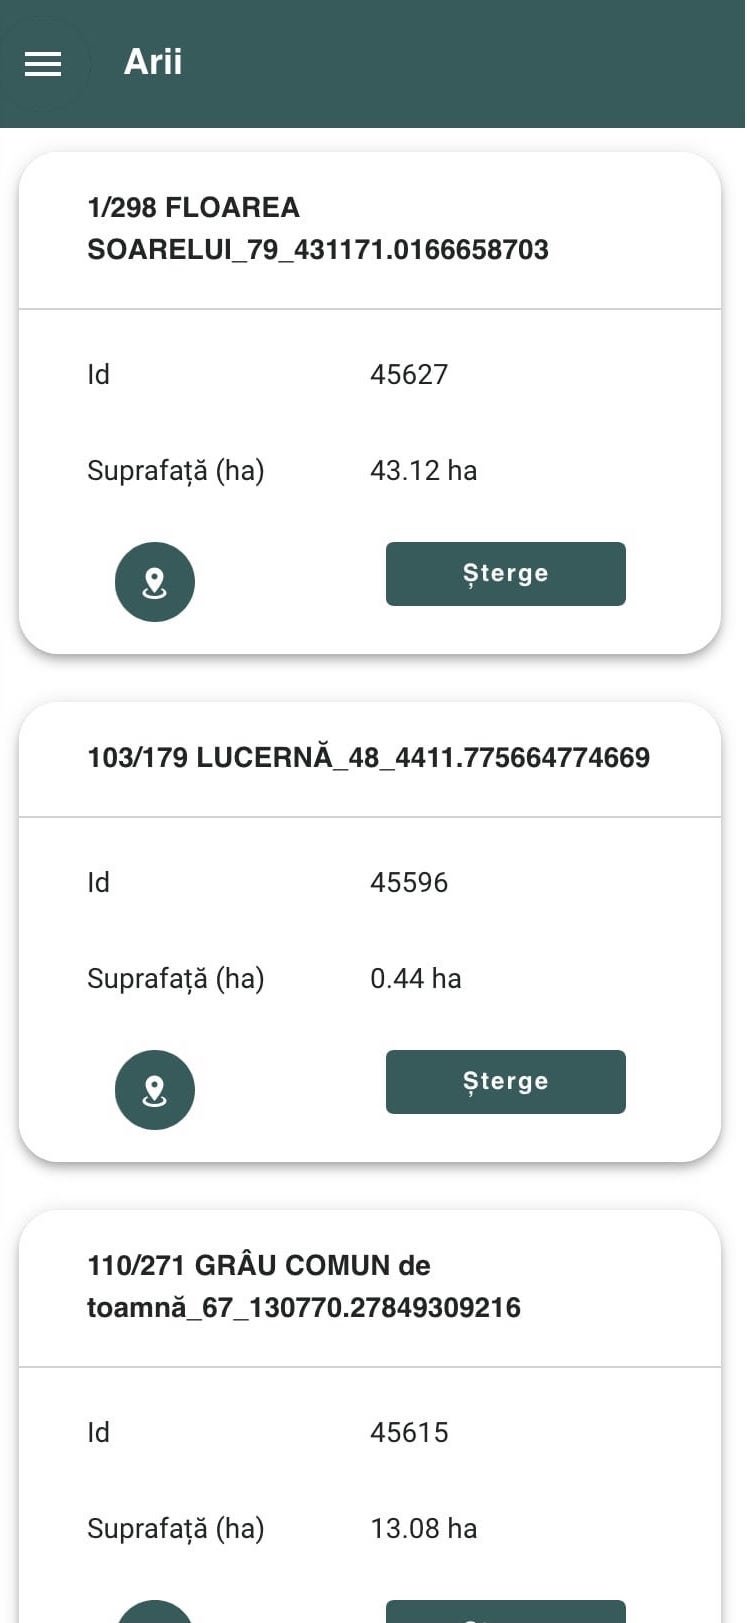
Since the agriculture farm management software platform was primarily intended for use on mobile devices or tablets, the area listing screen was designed differently on mobile to facilitate quick access to information.
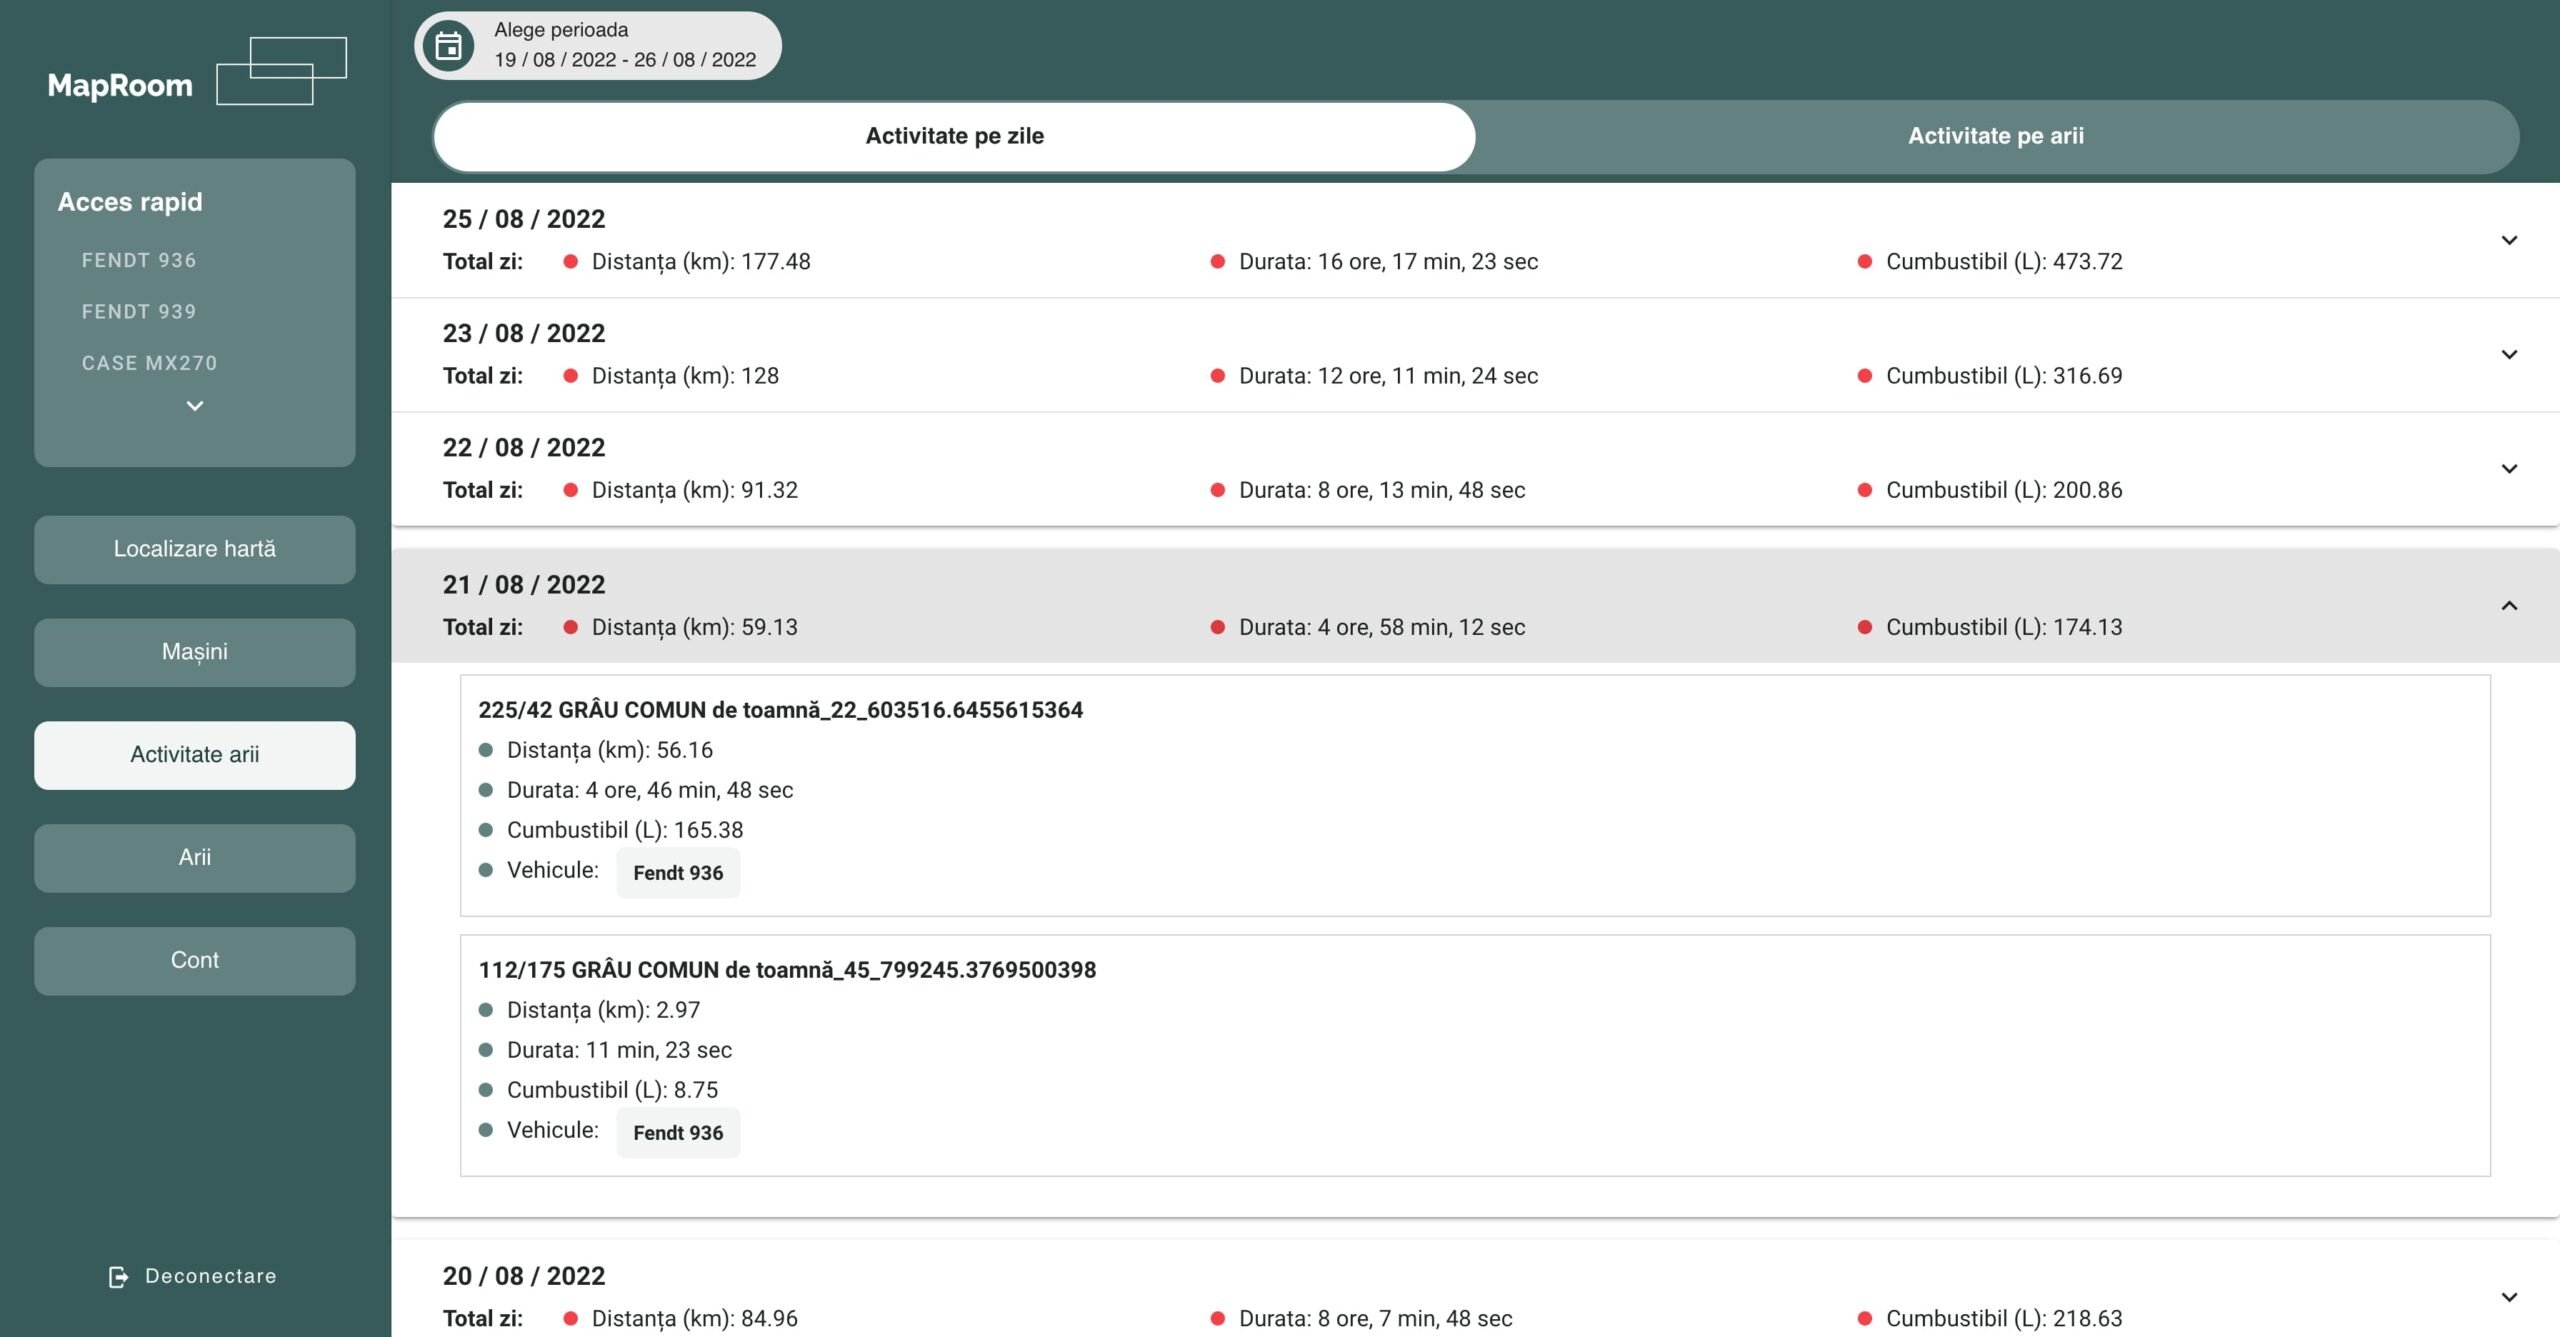
Area activity screen
On the area activity screen, reports on agricultural activities in relation to the areas are displayed in the agriculture farm management software platform. Since in the case of vehicle reports, the individual activity of tractors or agricultural vehicles can be analyzed, a dedicated screen was needed, where the farmer could analyze the activity at a general level, by day, or by area. For that, I divided this screen into two tabs and generated reports for Activity by days and Activity by areas. Depending on the grouping mode selected (by days or by area) the total distance, duration and fuel are displayed. If the user clicks on a line, a list of partial reports that make up the displayed total will open.
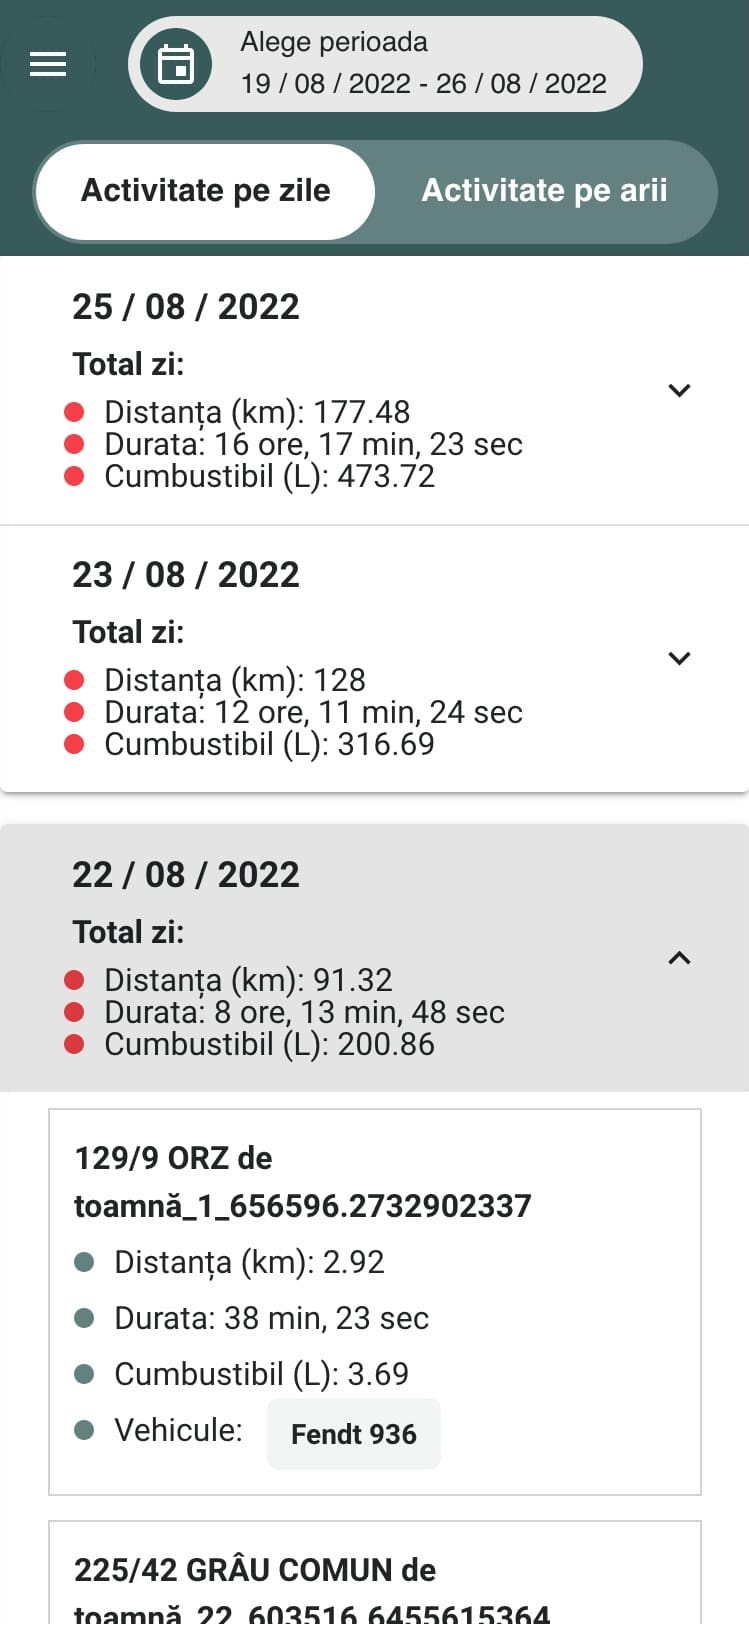
The screen has been restyled for the mobile version, in order to facilitate access to information and quickly preview the data about the areas.
Launch your own software platform with us.
We had the pleasure of being partners of successful companies, which developed their businesses and enjoyed the benefits of digitalization.